EPANet’s water quality simulator models reactions occurring in the bulk flow with n-th order kinetics, where the instantaneous rate of reaction (R in mass/volume/time) is assumed to be concentration-dependent according to:
![]()
where Kb = the bulk reaction rate coefficient, C = reactant concentration (mass/volume), and n = reaction order. Kb has units of concentration, raised to the (1-n) power, divided by time. It is positive for growth reactions and negative for decay reactions.
EPANet can also consider reactions where a limiting concentration exists on the ultimate growth or loss of the substance. In this case, the rate expression becomes:
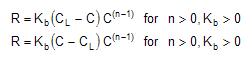
where CL = the limiting concentration. Thus, there are three parameters (Kb, CL and n) that are used to characterize bulk reaction rates. Some special cases of well-known kinetic models include the following:
Mode Parameters Examples
First-Order Decay CL = 0, Kb < 0, n = 1 Chlorine
First-Order Saturation Growth CL > 0, Kb > 0, n = 1 Trihalomethanes
Zero-Order Kinetics CL = 0, Kb <> 0, n = 0 Water Age
No Reaction CL = 0, Kb = 0 Fluoride Tracer
The Kb for first-order reactions can be estimated by placing a sample of water in a series of non-reacting glass bottles, and analysing the contents of each bottle at different points in time. If the reaction is first-order, then plotting the natural log (Ct/Co) against time should result in a straight line, where Ct is concentration at time t, and Co is concentration at time zero. Kb would then be estimated as the slope of this line.
Bulk reaction coefficients usually increase with increasing temperature. Running multiple bottle tests at different temperatures will provide more accurate assessment of how the rate coefficient varies with temperature.