The Profiles functions under main menu allow you to draw sections of the longitudinal ground and energy grade profile of pipes in the system. This is also very helpful in interpreting the results of an analysis.
To specify which pipes are to be included in the long section plot, select Profiles > Define and Show Elevation Profile. At the ensuing prompts, click sequentially on the first link (i.e. Pipe 1 from the WTP clear-well), then click on the second link (which is the pump, and is connected to the previously selected link), and finally click on the last link in the system (Pipe 7, which ends at the balancing tank). Enter D, so the largest diameter will be used when deciding which route to find between second and last link. The Quick Profile window will then appear, which displays the long section plot and underlying data (viz. the links starting from the WTP clear-well, through to the balancing tank, i.e. pipe 1, pump 2, and pipes 3, 4, 5, 6 & 7).
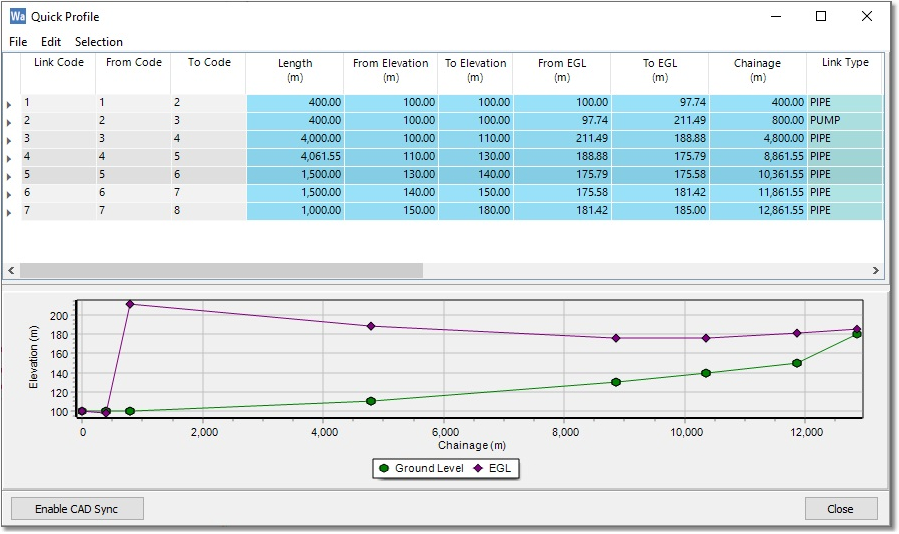
Notice how the ground profile of the pipes rises from the WTP, through to the balancing tank. The EGL profile is highest just downstream of the pump, then bottoms out in the network, before rising to be connected to the balancing tank again.
The long section can later be quickly redrawn by selecting Profiles > Show Defined Elevation Profile. This will, again, open the above Quick Profile window, displaying the table and long section plot. Note that the sequence of link numbers that defines the long section can also be edited in the above table.
After clicking on the Enable CAD Sync button, every click in the table or on the profile graph will synchronize with the CAD/GIS display of the model.
Advanced settings of the long section display can be accessed via Edit > Edit chart (from the Quick Profile window menu). The settings allow the full customization of the graph, such as definition and set-up of data series, colours, line styles, and axes. These advanced long section settings, however, fall outside the scope of this tutorial. Finally, the long section can be printed via File > Print (of the Quick Profile window menu).