A much better way to view and interpret the data and results is through the Albion CAD/GIS environment.
First, in this environment, the results of each individual system element can be viewed by accessing the Database box for the particular element. For instance, access the Database box of Pipe 3. In the Results section, it will show a Flow rate of 153 L/s (equal to the pump flow), at a velocity of 1.2 m/s, resulting in a Headloss of 22.6 m. Access the Database box of node 15. The Results tab shows an EGL of 169.7 m a.s.l. When the elevation of 150 m a.s.l is subtracted from this, it results in a liquid head (Head) of 19.7 m, which for water equals a Pressure of 193.2 kPa.
By theming the system display, the nodes and links can be drawn in different colours, line styles, sizes, etc. to display and interpret the data and balanced results. The most basic such query is perhaps to display the pipes in the system with different colours for the various diameters (the default display theme after program installation). After balancing, however, one might want to see the pipes coloured in accordance with their residual pressures.
A range of predefined themes are loaded on program installation, and should be sufficient for almost all users, barring some advanced users. You also might want to increase the line thickness for this specific model.
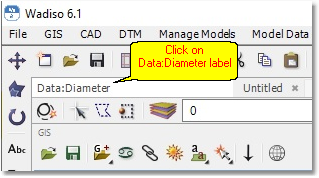
To change the display theme, click on the Data:Diameter label.
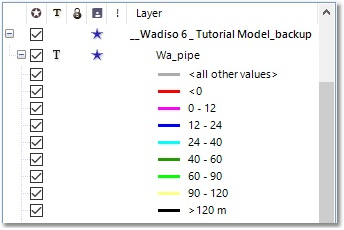
A list of themes will be shown. Select Analysis > Demand Head.
It will become apparent that the GIS Layer Manager changed to reflect the new display settings (which now themes the pipes in accordance with their pressure heads, as follows):
The model display will look as follows (after changing the pipe thickness to 30 m and adding the direction arrows).
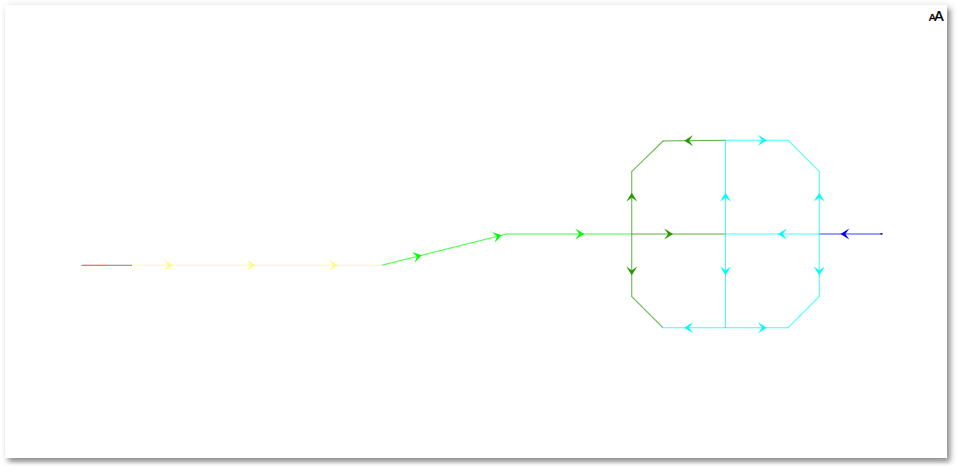
The Flow Direction can be of particular interest in some cases. The above sample theme has been set up with arrows depicting the flow direction. Direction arrows can be enabled for a link layer by means of the Render Settings function. First, right-click on the Wa_pipe layer, then select Render Settings, and then click on the Direction Arrows button (bottom right). Enable direction arrows with the Show direction arrows check box. Additionally, the user can select a field containing real values to swap the direction of the arrows, if negative, or remove direction arrows if values are small or empty.
Similar theme setups that focus on the nodes are available, with different circle colours and sizes, but they are perhaps not as meaningful as those which have been set up with the focus on pipes.
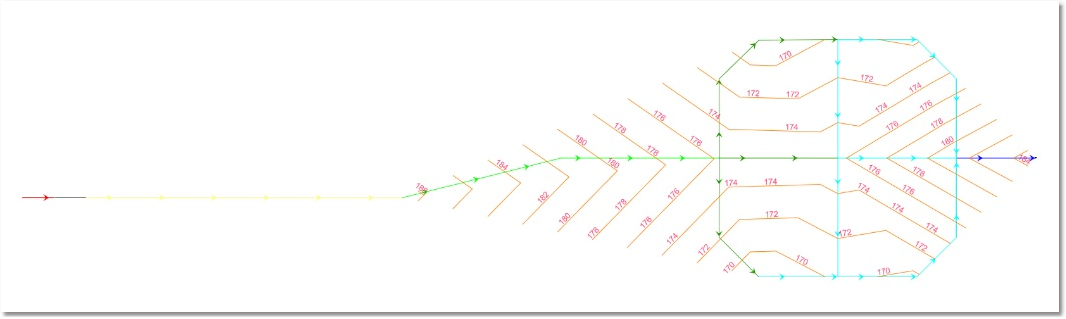
Contours of EGL or pressure head can now also be generated by selecting Analysis > Steady State > Generate Pressure Contours. The Generate Contours dialog box will appear, with many options that can be set, as indicated in the diagram below:
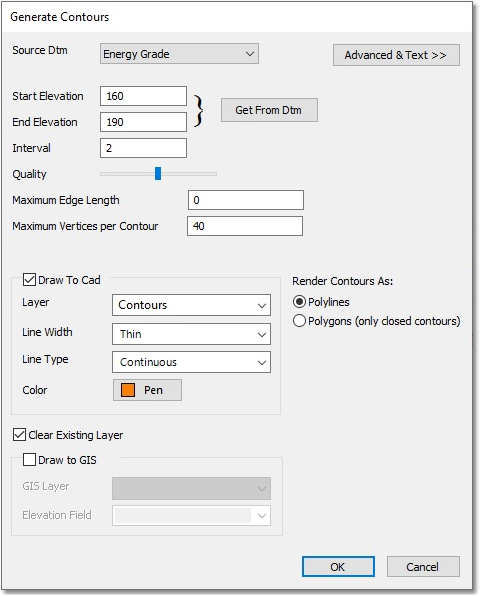
Set the Source Dtm to Energy Grade (or Pressure head). Click the Get From Dtm button. Set the Interval to 2 m and Maximum Edge Length to 0 m.
Note: It is important that you set the Maximum Edge Length to 0 m for this example, otherwise no contours will show on the screen.
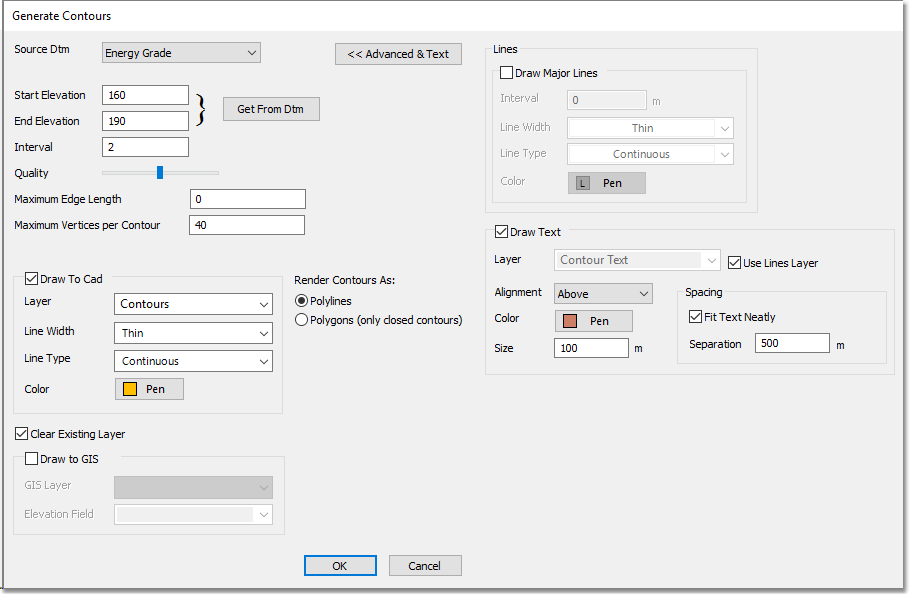
Then, click the Advanced & Text >> button. The Draw Text tick box must be ticked. Set the Separation interval to 500 m. Set Size to 100 m. Pick a colour for the contours and text from the Pen buttons, located on the Draw To Cad and Draw Text panels respectively. The Generate Contours box, when filled with the above parameters, should look similar to the following:
Finally, click OK to generate the contours (see diagram below). The contours will be generated on the specified layer labelled Contours.