To run the time simulation, select Analysis > Time Simulation > Run Simulation, or click on the ![]() Time Simulate toolbar button. A successful simulation should result with no error messages. The simulation results can now be investigated.
Time Simulate toolbar button. A successful simulation should result with no error messages. The simulation results can now be investigated.
For full Time Simulation Results, pick a time using Analysis > Time Simulation > Select Time, say 79 h. Then, open the Pipe/CV table using Analysis > Time Simulation > Result Tables > Pipe/CV, and view the Flow for e.g. Pipe 13, which should be 24.5 L/s. Select another Time, say 24 h, open the Pipe/CV table again, and view the Flow for Pipe 13 again, which is now 11.8 L/s. All results for all model elements are available in this manner, for each time step. The themes are also updated as you scroll through time steps.
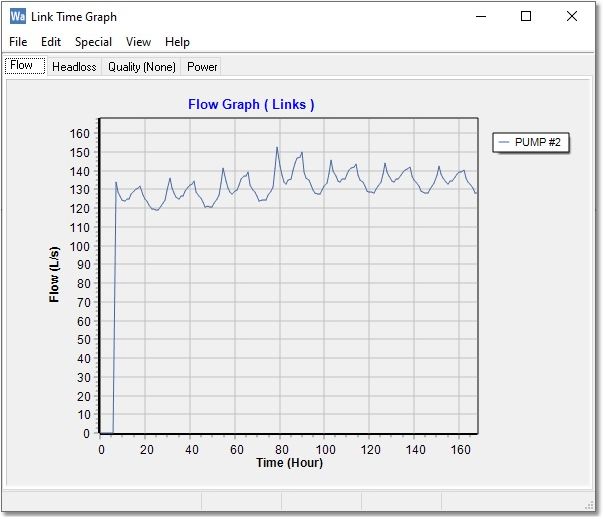
In the graphical interface, select Pump 2. Use Analysis > Time Simulation > Result Tables > Result Graphs to see that the pump operates at 120 to 150 L/s for most of the time, which translates to 1.2 to 1.5 x AADD.
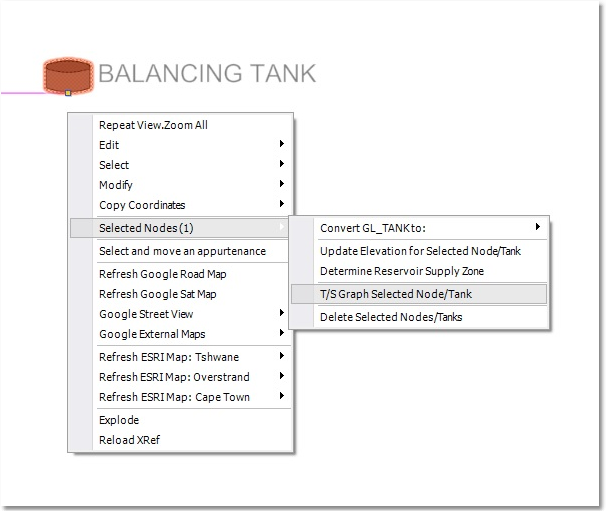
Still in the graphical interface, select Tank 8. Use Analysis > Time Simulation > Result Tables > Result Nodes. Alternatively, use the right-click menu as shown below:
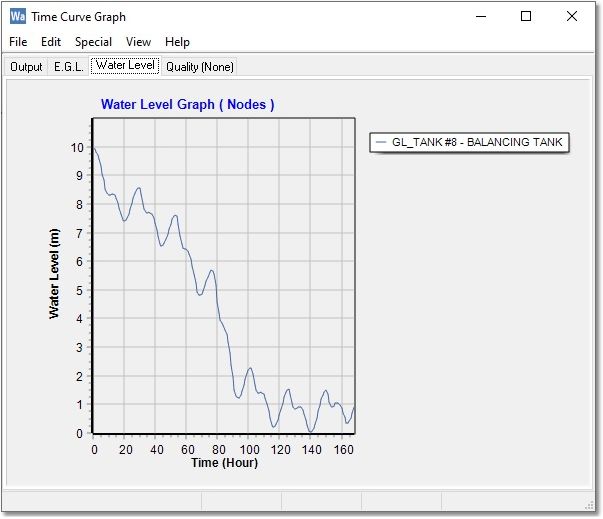
The Time Curve Graph window will open, where you can see on the Output tab that the tank functions as a balancing tank, with fluctuations between in (+) and outflow (-). On the Water Level (Head) tab, it can be seen that the tank almost empties, but then starts recovering (see screen-shot below).
You have now completed the Time Simulation Tutorial.
Exit the Wadiso 6 program at this stage, not saving any data.