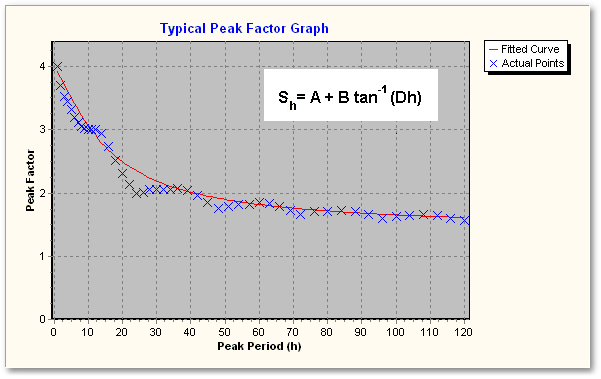
The intensity and duration of the peaks in demand can conveniently be described by a peak factor curve as shown below.
Peak Factor Curve
First, a peak period has to be defined:
•The h-hour peak period is that period of h consecutive hours within a year during which the highest consumption is recorded.
The 1-hour peak period will therefore be the maximum hour on the peak day. The 24-hour peak period will be the day with the highest demand, and the 168-hour peak period the week with the highest demand. When expressed as peak factors, the average demand rates during these peak periods are divided by the annual average demand rate (G). The peak factor for the h-hour peak period is given the symbol Sh. A plot of these peak factors against peak period is called a peak factor curve. The figure “Demand Fluctuations” show a peak factor curve for the year of data and the hourly demand portrayed. If extended to h = 8 760 hours (i.e. the number of hours in a year) the curve will, by definition, finish at S8760 = 1.
The waviness of the peak factor curve is due to the fact that a fixed 24-hour demand pattern is superimposed on the daily demand pattern. For mathematical ease, it can be approximated by any smooth function. The inverse tangent function (equation 1) describes adequately the trends of most peak factor curves.
Sh = A + B tan¯¹ (D h) ....................................... ...(1)
With:
h = Peak period (hours)
A,B,D = Coefficients
A peak factor curve is a prerequisite for the application of the critical period technique. By supplying Wadiso with the basic water demand information, viz. average annual demand rate, peak day factor, and a 24-hour demand pattern. The program is capable of constructing a realistic peak factor curve.