The results are presented in a table:
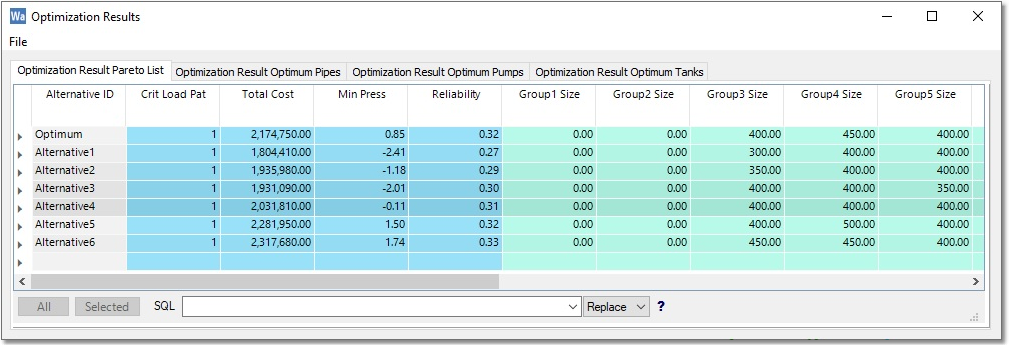
The Optimum is presented on Row 1, with the Critical Load Case 1 and Total Cost of R 2,174,750. In addition, the minimum pressure for the solution is 0.85 m above the minimum specified. The reliability value (an indication of redundancy) is also displayed, followed by the actual size selected per group. A size of zero indicates Elimination.
A detailed breakdown of above pipe cost is available on the Optimization Result Optimum Pipes tab.
Furthermore, size Pareto optimal alternatives are presented, of which:
•Two are more expensive than optimum, but give better pressure.
•Four are cheaper than the optimum, but violate the pressure requirements.
To view this graphically, exit the table, and select Analysis > Optimization > Optimization Graph from the main menu:
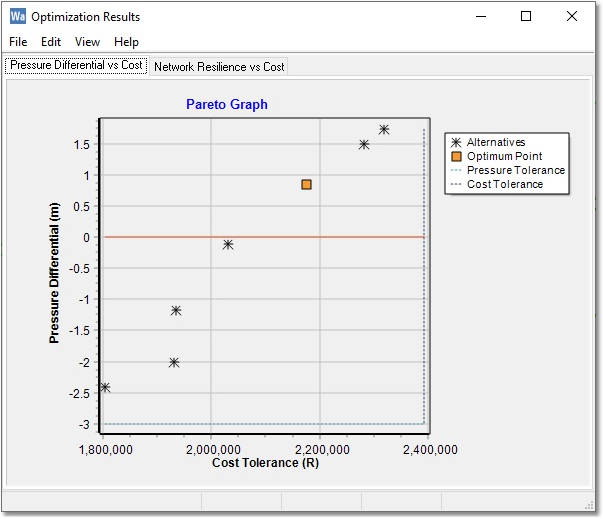
On this graph, one can deduct:
•To the right of the optimum point, one is looking for a steep slope, i.e. low extra cost for higher pressure.
•To the left of the optimum point, one is looking for a flat slope, i.e. large cost saving for small pressure drop.