A time series graph of Time/WQ Simulation results for individual links and nodes selected in the Albion environment can be viewed with the Graph Editor in the following ways:
•For Links:
oUse the main menu and select Analysis > Time Simulation > Results Tables > Result Graphs.
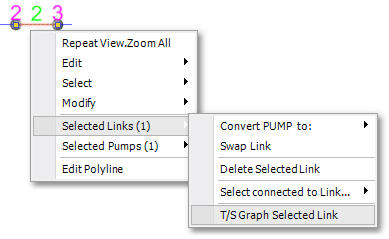
oAlternatively, use the right-click menu, as shown below.
•For Nodes:
oUse the main menu and select Analysis > Time Simulation > Results Tables > Result Nodes.
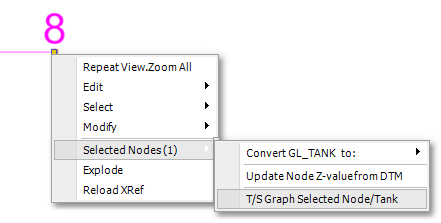
oAlternatively, use the right-click menu, as shown below.
For links, a graph window with up to 6 graph tabs (but not all applicable to the specific link types) is displayed, namely a time series graph for each of the following:
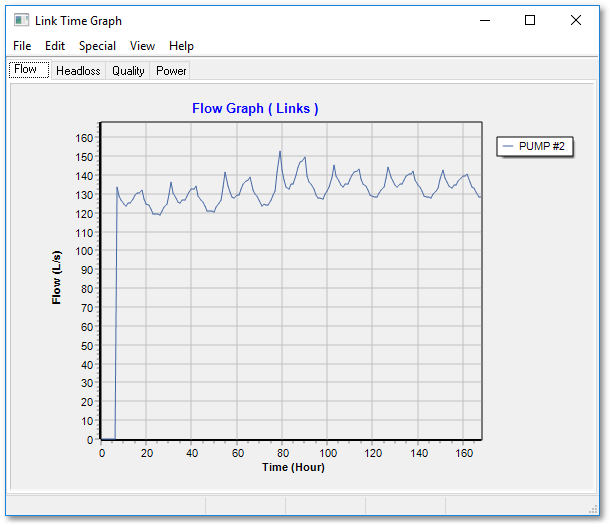
•Flow: The flow rate in the link, with flow direction From_Code To_Code.
•Velocity: The flow velocity in the link (not applicable to pumps).
•Headloss: The head loss / head gain over the Link.
•Gradient: The energy gradient over the Pipe/CV (not applicable to pumps and valves).
•Quality: The water quality in the link.
•Power: The power consumption of the pump (not applicable to pipes and valves).
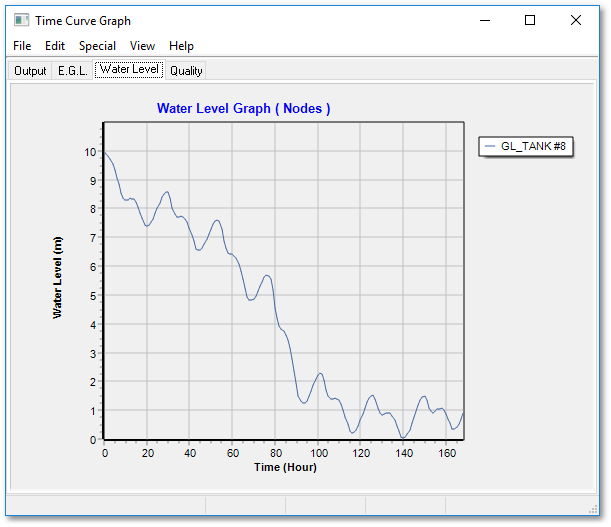
For nodes, a graph window with 4 graph tabs is displayed, namely a time series graph for each of the following:
•Output: The water demand, or tank inflow/outflow, of the node.
•EGL: The energy grade line, or total hydraulic head, of the node.
•Head/Water level: The pressure head, or tank water level, of the node.
•Quality: The water quality of the node or tank.
Each of the 10 graph tabs can be customized, zoomed, annotated, saved, etc., in accordance with the graphing capabilities of Wadiso.
The graphing capabilities also allow the user to import any series of data points, e.g. a field measurement over time, and to plot this on the graph. This is helpful for comparing the time simulation results with field measurements, for the purpose of calibration.
The time series graphs of individual links/nodes can be extended to view, simultaneously on the same graphs, the time series of up to 6 selected links, or up to 6 selected nodes.