Viewing the time/WQ simulation results of multiple links/nodes on the same time series graphs (with the Graph Editor) is possible in the following ways:
•In the Albion environment (or within the result tables), by making a selection set of links or nodes, and then selecting from the main menu Analysis > Time Simulation > Results Tables > Result Graphs. Alternatively, you can use the right-click menu of the selected links/nodes, instead of using the main menu, as described for individual links/nodes (note, the number of selected entities will, in this case, appear in the right-click menu).
•Whilst in the Graph Editor displaying a time series, links and nodes can be added and/or removed from the graph display by selecting the menu option Special > Select Links/Nodes (from the Graph Editor menu, as described in the section on Selecting Links/Nodes/Objects for the graph).
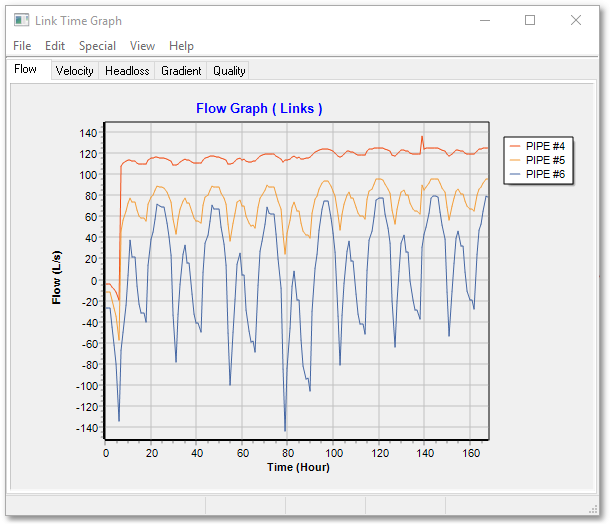
Such multiple view graphs will use different settings (e.g. line colours to distinguish between the displays of each link/node). These settings can be customized using the graphing capabilities of Wadiso.
The graphing capabilities also allow the user to import any series of data points, e.g. a field measurement over time, and to plot this on the graph. This is helpful for comparing the time simulation results with field measurements, for the purpose of calibration.
Graph Editor windows are non-modal, i.e. more than one can be opened at the same time. Multiple graph windows can therefore also be used to simultaneously view graphs of more than 6 links/nodes. Multiple windows is the only way to simultaneously view graphs of links and nodes, e.g. to compare pressure head at a node with the flow rate in a link connected to it.