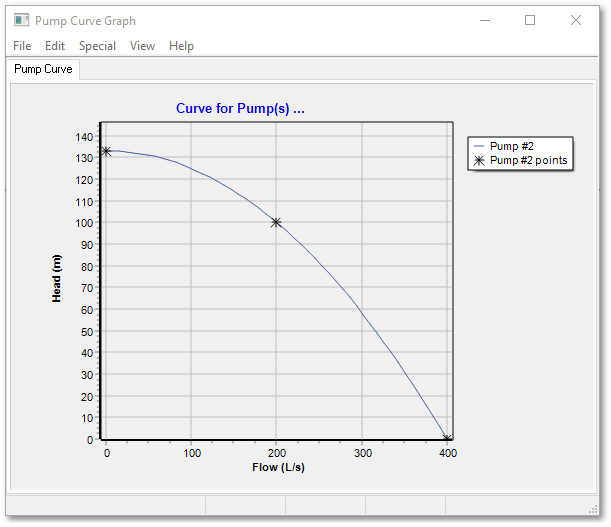
An X-Y type graph provides a meaningful way to view/check certain data related to a network analysis, as well as a tool for viewing and interpreting results. A flexible graphing function (Graph Editor) has therefore been built into the program. The capabilities and settings of this graphing function are described in this section.
A typical Pump Curve Graph (Flow-Head) for a pump is shown below:

Other X-Y type graphs include time series results of a time/WQ simulation analysis, a cost vs pressure plot of the optimum and Pareto Optimal results after an optimization run, Cost functions, Time patterns, etc.
The Graph Editor is accessible from certain input/results tables and also from the right-click menus when right-clicking on a node/link in the Albion environment. The Graph Editor menus and options are:
•File, with
- Save Page as .BMP
- Save Series to Data file
- Save Graph to Disk
- Load Graph from Disk
- Settings
- Save Session settings
- Print/Preview
- Exit
•Edit, with
- Copy to Clipboard
- Insert Annotation
- Add/Edit Series
-Edit chart
•Special, with the following options depending on the type of graph
- Select Pumps (Pump Curve Graph)
- Select Links (Time Series Graphs for Links)
- Select Nodes (Time Series Graphs for Nodes)
•View, with
- Zoom
- Zoom All
•Help – which gives access to the Wadiso on-line Help facility.
The following topics, related to graphs, are also discussed in the next sections:
•Customizing the appearance of a graph series
•Special graph editing functions
•Selecting links/nodes/objects for the graph
•Adding data points and/or links to the graph
The user can interact with the Graph Editor by either selecting options from the menu, or right-clicking on the graph and selecting an option from the context menu.