A successful time/WQ simulation run produces results and status over time, which can be viewed in a variety of ways. The result for every link and node, including pressure heads, flows, velocities, and water quality are stored in a binary file format for every reporting time step. Wadiso can access this binary file to display/query the results in the following ways:
•Timestep-by-timestep tables of results
•Time series graphs of individual links and nodes
•Time series graphs of multiple links and nodes
•Timestep-by-timestep graphical queries of results
•Timestep-by-timestep results of individual links and nodes
The Time Selector plays an important role in displaying the above-mentioned time simulation results. The drop-down list box provides the available times from the time/WQ simulation results report. It can be activated via Analysis > Time Simulation > Select Time.
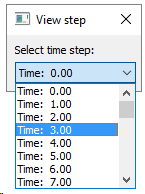
By default, the selected time straight after a time/WQ analysis is 0.0, i.e. the system state/condition as at the start of time simulation. The time can be changed by selecting any of the available times from the Time Selector drop-down list box, which are related to the reporting time step set in the Times tab of the Time/WQ Settings.
The Time Animator is another useful feature in viewing the time simulation results, after a successful time/WQ simulation has been performed. It allows the user to select a start time and end time for the time series animation, and then automates the incremental selection of a new reporting time step to update the results tables. It can be activated via Analysis > Time Simulation > Time Series Animation.
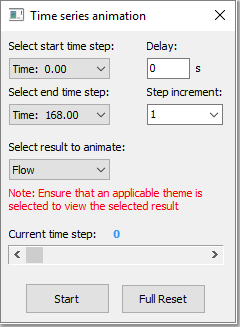
An input box is provided to enter a delay time (in seconds), to control the rate at which the results are loaded from one time step to the next. A drop-down list box is provided to select a time step increment for the animation. The user is required to select the simulation result that should be animated, from the drop-down list provided. The graphical representation (current theme) is updated for each step, and therefore the theme selected for display should render data for the result option chosen, e.g. the Analysis:Flow Rate theme for the Flow result, or no change will be observed during the animation. The current time step, as well as a scroll bar indicating the progress of the animation, is displayed. The scroll bar limits will be set as the selected start time and end time of the animation. Once the animation has started, it can be paused, and then either reset or continued (resumed). As with the Time Selector, the scroll bar can also be used to view the results of a time step before the animation has started, or while in a paused state.