The appearance of each data series on the graph can be customized. This is done by selecting Edit > Add/Edit Series (from the Graph Editor menu), which will then open the Add Series dialog box. The Series Editor box can be opened by clicking the Edit buttons located on the Add Series box (or by clicking the Add Line/Add Points buttons, which will then also add a new series to the list). The Add Series and Series Editor dialog boxes are shown below.
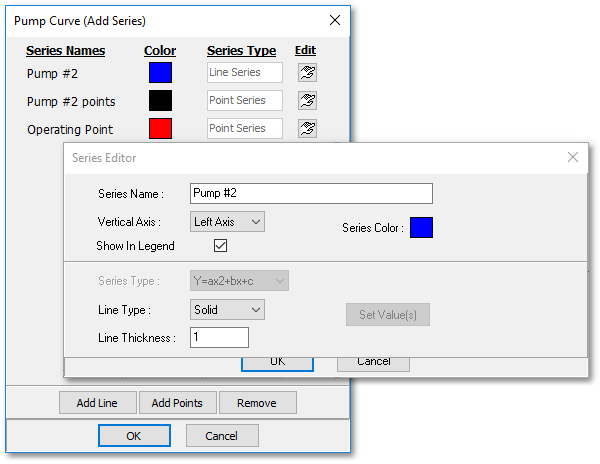
It is possible to change the colour of the series by clicking on the Series Color button. In addition, the series name, and whether it should appear in the legend, can be specified.
There are 2 different types of series, viz. a line graph, or a data point series. A line graph is typically the continuous line representing the mathematical function of a pump curve or simply a horizontal or vertical datum line on the graph. A data point series may be the three pairs of data points through which the pump curve was fitted. The parameters for a line graph series and a data point series differ:
Line graph series
- The line type and line thickness can be set.
Data point series
- The point shape (e.g. triangle, circle, etc.) can be set.
- A label can be specified. There is a choice between labeling only the X-values, the Y-values, or both.