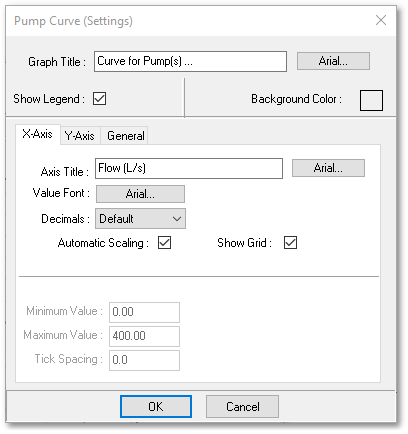
The appearance of the graph can be customized. Use File > Settings (from the Graph Editor menu) to display the Settings dialog box as shown below:
This dialog box can be used to:
•Change the graph title and font used.
•Change the background colour.
•Switch the legend on or off, and to specify the legend position.
•Set the parameters and titles for the axes, which include:
- Axis title and font
- Value font, for the font used as values on the axis.
- Decimals, to specify the numeric format for the axis text.
- Show grid, to switch the grid background ON/OFF.
- Automatic scaling. If OFF, the user must specify a min/max value and a tick spacing.
•Set general parameters for the Graph, including:
- Label font, arrow length/colour for labeling point values.
- Annotation font.
Within a Wadiso session, these settings can be retained by selecting File > Save Session Settings (from the Graph Editor menu).