The Edit > Edit chart menu option of the Quick Longsection window opens a dialog box that allows the user to set various profile settings that will define how the long section should be displayed. The more frequently used settings are described below:
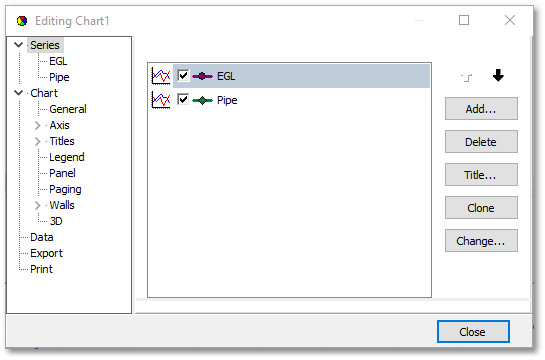
•Series - Tick boxes next to the series names (listed in the central frame) can be ticked to specify whether ground elevation (Pipe) and/or energy grade line (EGL) should be drawn.
oAdd... - The Add... button can be clicked to add a new user-specified series to the chart. A table grid will appear where the X, Y values can be entered.
oDelete - Click Delete button to delete a selected chart series
oTitle... - The chart series name can be specified/edited by clicking the Title... button.
oClone - Makes an exact copy of the selected series.
oChange... - Opens the TeeChart Gallery dialog box from which a different chart type (e.g. Line, Bar, Horizontal Bar, etc.) can be chosen for the selected series.
oEGL, Pipe - A chart series can be selected by clicking on it in the tree view, or by double-clicking on it in the central frame. The central frame will then be updated with numerous options that can be set for the selected series via the following main tabs: Format, Point, General, Marks and Data Source. The latter contains the X,Y values for the series in an editable table grid.
•Chart - Defines all the chart interaction/display settings, consisting of the following:
oGeneral - parameters of the chart Mouse/Zoom/Scroll/Cursor/Fonts/Palette/Hover functionality
oAxis - The main chart axis such as Left Axis (Y), Right Axis, Top Axis and Bottom Axis (X) can be selected from a drop-down list for which various options can be set via the following main tabs: Scale (such as Min and Max axis values), Title (i.e. axis title), Labels, Axis (such as axis Color, Width Transparency, etc.), Ticks, Grid, Position and Items.
oTitles - The type of chart title (viz. Title, SubTitle, SubFoot, Foot) can be selected from a drop-down list for which the following parameters can be set: Position, Options (Visible tick box), Text (title text ,Text alignment and Rotaion), Margins and Format (Font and Color).
oLegend - The chart legend can be defined via the following tabs: Style, Position, Symbols, Title, Items, Format and Lines. The Items tab allows editing of the text to appear in the legend (e.g. 'Pipe' can be changed to 'Ground Level of Pipe').