Profiles > Generate Long Section opens the GIS Long Section Settings window. The settings used to create the Long Section drawing is entered in this window, and can be saved as a new default to use in the future. A Long Section drawing can be generated by first defining a new profile in the same way as described for Profiles > Define and Show Elevation Profile (Define & Generate), or from the current profile as previously defined within the same work session (Generate predefined). The settings are described below:
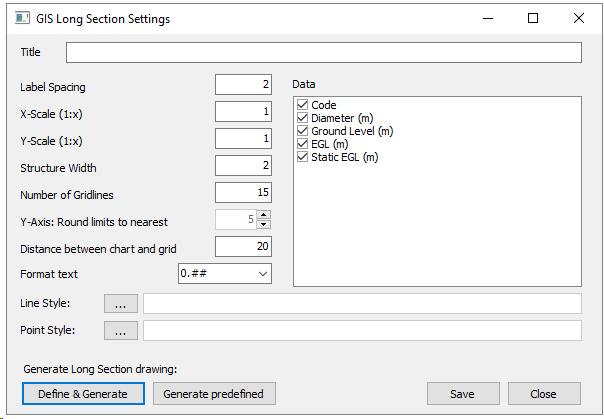
•Title: Defines the Long Section title.
•Label Spacing: Defines the spacing between labels and gridlines.
•X-Scale: Defines the horizontal scale.
•Y-Scale: Defines the vertical scale.
•Structure Width: Defines the width at which manhole structures are drawn.
•Number of Gridlines: Defines the number of horizontal lines to be drawn.
•Y-Axis: Round limits to nearest: Defines the value to round the upper and lower bounds of the vertical axis based on the required number Number of Gridlines.
•Distance between chart and grid: Defines the distance separating the data grid from the main chart.
•Format text: Define the format with which numbers will be displayed.
•Line Style: Select a style to be used to render the section. If no file is selected, or if the specified style file does not exist, a default style will be loaded.
•Point Style: Select a style to be used to render the section. If no file is selected, or if the specified style file does not exist, a default style will be loaded.
•Data: Defines which data fields will be rendered in the data grid.
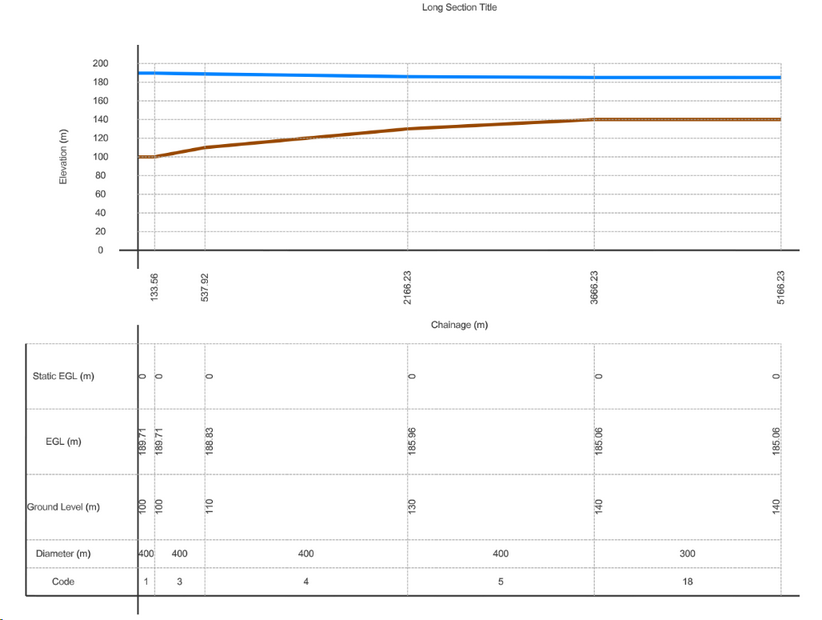
A new drawing will be created with two new GIS layers, i.e. Chart_Lines and Chart_Points. The selected style (or default style) for each will be applied. The Chart_Lines layer is used to draw the axes, gridlines and model entity data, while the Chart_Points layer is used for labelling. The two GIS layers can be saved for future reference or converted to CAD only representation by using the 'Divorce from GIS' function, available from the right-click context menu on the GIS layer name.