A graph can display the data/results of multiple links or nodes. This is applicable to those graph types which display data/results of a link or node element in the system, such as pump curve graphs or time series graphs of time/WQ simulation results. The Special > Select Pumps/Links/Nodes (of the Graph Editor) activates the following dialog box for purpose of adding/removing series from the graph.
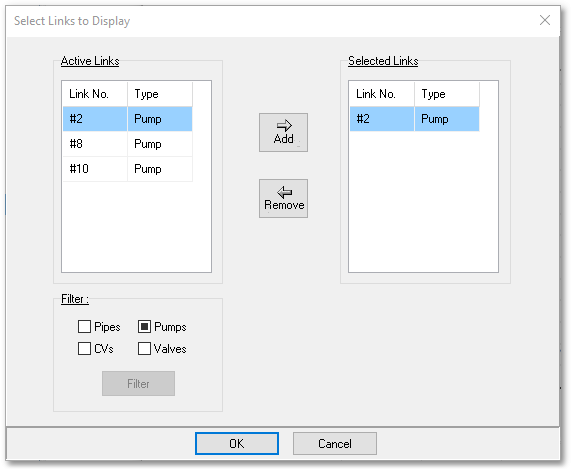
The window on the right lists all the elements which are currently displayed on the graph. The window on the left lists all the elements available in the system, in accordance with the filter switch in the bottom left hand corner. For pump curve graphs, this filter automatically only allows pumps. For time series graphs, the filter can be used to disallow certain system elements in order to simplify selection.
Elements are added and removed from the graph’s series by highlighting the element with cursor movements, and then using the Add or Remove buttons. A maximum of 6 elements can be displayed on a single graph.
Every time pump(s) are added or removed, the program will generate a new graph, using the default settings. Also, all annotations will be lost.
Multiple elements/objects for graphing can also be selected in the following ways:
•By highlighting the elements/objects in the relevant table (e.g. Pump table, Pipe Cost Functions table, Curve Data table) before activating the graph.
•By selecting links and nodes in the Albion environment.
•After selecting the nodes/links with either one of the above methods, the graphs can be viewed as described in the section on types of graphs, viz.:
oRight-clicking the selection and use the right-click menu , e.g. for pump curves: Selected Pumps (3) > Graph pump curves (also note, the number of nodes/links selected e.g. 3 will be indicated in the right-click menu); or
oUse the main menu, e.g. for pump curves: Model Data > Model Table > Graph Selected Pump Curves.
oSee Time Series Graphs of multiple links and nodes for a description on how to view multiple result graphs via right-click menus or main menu items.