The Pump Results table is accessed by selecting Analysis > Steady State > Result Tables > Pump.
The system data is displayed, together with the following balanced results, for each pump in the system:
•The nodes are displayed in the flow direction “From” - “To”.
•The balanced status (ON/REMOVED) of the pump
•Pump flow rate
•Pump head
•Pump power
•Average energy head
•The energy head at the upstream node
•The energy head at the downstream node
•Average pressure head
•The pressure head at the upstream node
•The pressure head at the downstream node
•The a, b and c parameters of the parabola defining the pump curve (if applicable).
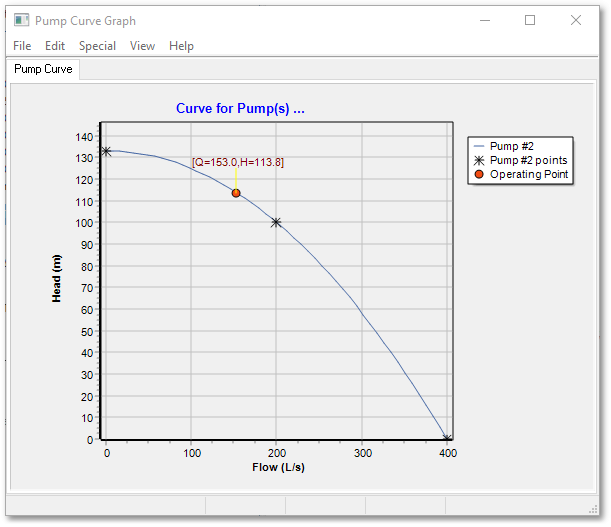
A graph of the pump curve, showing the balanced operating point, can also be viewed (in the Graph Editor) by selecting the pump link, and then from the main menu, choosing Model Data > Model Tables > Graph Selected Pump Curves, or by right-clicking on the pump link and using Selected Pumps (1) > Graph pump curves.
Optimization data, Time/WQ simulation data, and the water quality results also appear in the table to the right of the balanced results. These aspects are discussed in the relevant sections.