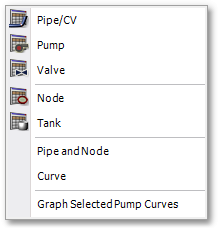
The data on the distribution system (i.e. Model Data) can be viewed and edited in a number of ways e.g.:
•Using the spreadsheet type table editors, accessible via Model Data > Model Tables.
•Using the built-in Albion environment to displayed the data graphically, and to edit individual links, or nodes, or batch edit selected links/nodes.
The data on the distribution system is handled by Wadiso via the following tables (accessible via Model Data > Model Tables). These are:

•The Pipe & CV Table: Contains topology data such as link numbers, the type of link (i.e. Pipe or CV), the two nodes which are connected by the link, and the geometric route of the link between the two nodes. The table also contains the hydraulic data on pipes and check valves, e.g. diameter, length, etc., and physical data such as pipe material.
•The Pump Table: Contains the same topology data as described for the Pipe/CV Table, but the type of link can be Pump only. The table also contains hydraulic data on pumps, e.g. the characteristic curve definition and other physical data.
•The Valve Table: Contains the same topology data as above, but the link type can be many different valve types supported by Wadiso, such as e.g. FCV, PRV, PBV, PSV, TCV, GPV, etc. The table also contains hydraulic and physical data on the valves.
•The Node Table: Contains topology data such as node numbers and the type of node (i.e. ordinary nodes of type Node), as well as topographic data such as its elevation and geometric coordinates. The table also contains hydraulic data on the ordinary nodes, e.g. output.
•The Tank Table: Contains the same topology data as described for the Node Table, but the type of node can be Tank or tank subtypes only. The table also contains hydraulic data on the tanks, e.g. water level.
•The Pipe and Node Table: Is a combination of the Pipe/CV Table and the Node Table. Ideal to inspect certain pipes and their connected nodes.
•The Curve Table: Contains data pairs defining the relationship between two variables - typically required for pump curves and GPV head loss curves.
The layout of these spreadsheet type editors are all very similar. The common functionality built into these tables, such as e.g. find/replace, filters, printing, exporting, memo fields, etc. are discussed, in greater detail, in the Albion 6 GIS User Guide (see Albion 6 GIS User Guide > User Interface Elements > Database Table).