After a successful optimization, the optimization results can be viewed directly by clicking the OK button on the optimization status message box or can be viewed again later by selecting Analysis > Optimization > Optimization Results (from the Main Menu). Both methods give access to the Optimization Results table, where a summary of the optimization results is available on the Optimization Result Pareto List tab:
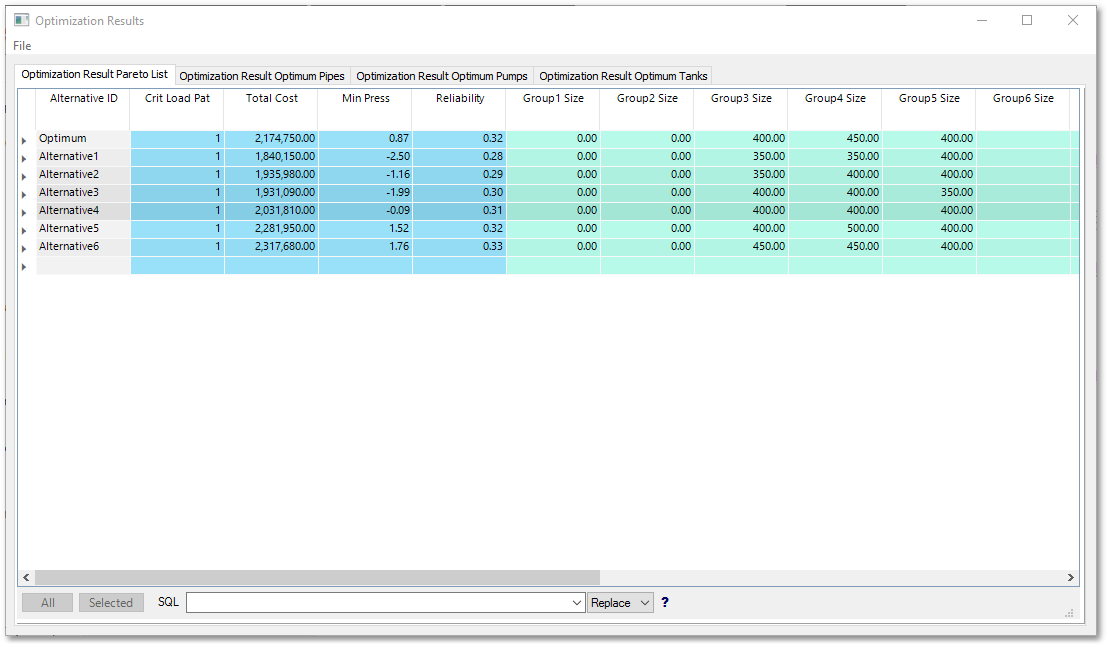
The first row in the above table, holds the optimum solution comprising of the following:
•The optimum diameter for each group of pipes is listed;
•together with the lowest pressure that this combination of pipe sizes delivers, above the required minimum pressure;
•as well as the load case number which generated this lowest pressure.
•The total cost for the solution is also indicated.
Below the optimum solution, the subsequent rows in the Optimization Results table list all Pareto Optimal solutions (non-inferior pipe size combinations, which are within the specified Pareto pressure and cost differentials). For each Pareto Optimal solution the same type of information is displayed in the table as for the optimum solution, viz.: The pipe size in each group is listed, together with the lowest pressure delivered by the pipes, above the required minimum, and the load case number. The total cost for Pareto Optimal solutions is also given.
The Optimization Results table is similar in nature to the system data editors and results tables. Therefore, it can also be exported and customized.
Details of the optimum solution can be viewed, as well as a graph of the pressures and costs of optimization results.
The optimization results can also be transferred to the system data.