The GIS Layer Manager box offers most of the Albion GIS functionality, accessible via toolbar buttons on the GIS Layer Manager Bar (see below, also in context with whole User Interface). Some specialised functions can, however, only be accessed from the GIS main menu and the GIS layer Manager: Right-click Menu.
Layout
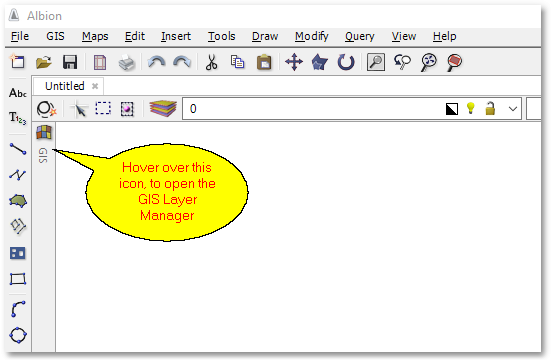
To open the GIS Layer Manager box
Move the cursor to the left side of the CAD window, hover over the ![]() GIS icon to make the GIS Layer Manager box visible (if not already visible).
GIS icon to make the GIS Layer Manager box visible (if not already visible).
The Pin Button
The ![]() Pin in and
Pin in and ![]() Pin out toolbar buttons can be toggled for the GIS Layer Manager box to stick to the left edge of the CAD window. If not pinned, then the GIS Layer Manager box will automatically disappear when work resumes in the main CAD window.
Pin out toolbar buttons can be toggled for the GIS Layer Manager box to stick to the left edge of the CAD window. If not pinned, then the GIS Layer Manager box will automatically disappear when work resumes in the main CAD window.
Opening a GIS project
To open a GIS project, click the Open Project toolbar button (icon) on the GIS Layer Manager Bar, or select from the main menu as indicated below:
GIS > Project > Open Project (select from Main Menu)
![]() Open Project (click icon on GIS Layer Manager Bar)
Open Project (click icon on GIS Layer Manager Bar)
Open GIS project.
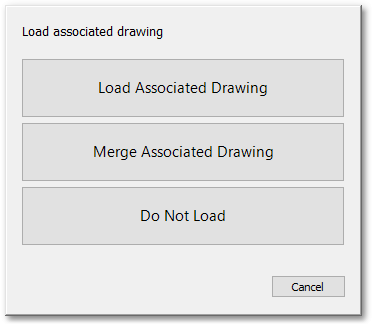
This function opens a GIS project file (*.agp) which can contain spatial data, tabular data and render settings of GIS layers. It can also load in a CAD drawing file (via the Load associated drawing box), if it was associated with the project.
See Also
Add Additional (Merge) Project
Saving a GIS project
To save a GIS project, click the Save Project toolbar button (icon) on the GIS Layer Manager Bar, or select from the main menu as indicated below:
GIS > Project > Save Project (select from Main Menu)
![]() Save Project (click icon on GIS Layer Manager Bar)
Save Project (click icon on GIS Layer Manager Bar)
Save GIS project.
This function saves a GIS project which can contain spatial data, tabular data and render settings of GIS layers. It can also save a CAD drawing file, if it is associated with the project. Note, the project will be saved in a GIS project file (*.agp) using the current file name and path (i.e. overwriting the existing file). Use Save Project As... to save the file with a new file name/path. Note, if the project has not yet been saved, then Save Project acts as Save Project As...
See Also
Adding a Layer from Existing Data
To add a layer from existing GIS data, click ![]() Add Data toolbar button (on the GIS Layer Manager Bar) and select from the ensuing drop-down menu the appropriate data format, or select from the main menu as indicated below:
Add Data toolbar button (on the GIS Layer Manager Bar) and select from the ensuing drop-down menu the appropriate data format, or select from the main menu as indicated below:
- Adding Geometric File Data
GIS > Data > Add Geometric File Data (select from Main Menu)
![]() Add Geometric File Data (select from drop-down menu on GIS Layer Manager Bar)
Add Geometric File Data (select from drop-down menu on GIS Layer Manager Bar)
Add Geometric Data.
The following data formats are supported: ArcView shapefiles (.shp), Google Earth (.kml) and SQLite (.sqlite). The latter two, viz. SQLite and Google Earth files, are compact single file databases that can contain one or many tables with or without geometry. The user can specify which tables of the SQLite database to load in:
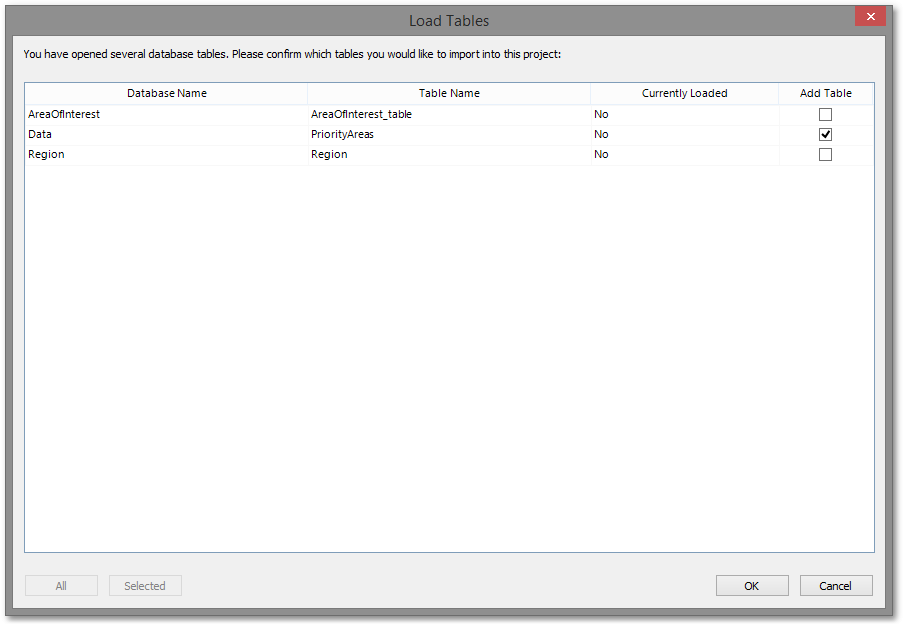
Only tables with the "Add Table" checkbox checked will be loaded into Albion. These can be turned on or off manually. However for larger lists of tables, the user may want to make use of the filtering and sorting features. It is possible to filter the list of tables by right-clicking on an individual item in the list and choosing "Select Equal" or "Select Not Equal". All cells that match the criteria will be selected. Click the "Selected" button at the bottom left of the window to display only those tables selected. Click the "All" button at the bottom left of the window to display the full list again.
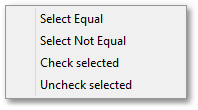
Use the "Check/Uncheck selected" options to check/uncheck the "Add Table" checkbox for any range of selected cells. To rapidly check/uncheck the all tables, simply click on the column header (such as "Table Name") to select all items, then use the "Check/Uncheck selected" options.
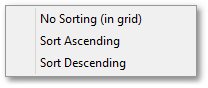
The table can also be sorted by right-clicking on the column header to expose the following menu:
- Adding File Data
GIS > Data > Add File Data (select from Main Menu)
![]() Add File Data (select from drop-down menu on GIS Layer Manager Bar)
Add File Data (select from drop-down menu on GIS Layer Manager Bar)
Add File Data.
Supports geometric file formats, but also the following non-spatial formats: XBase (.dbf), Comma Separated Values (.csv).
- Adding Data (from various sources)
GIS > Data > Add Data (select from Main Menu)
![]() Add Data (select from drop-down menu on GIS Layer Manager Bar)
Add Data (select from drop-down menu on GIS Layer Manager Bar)
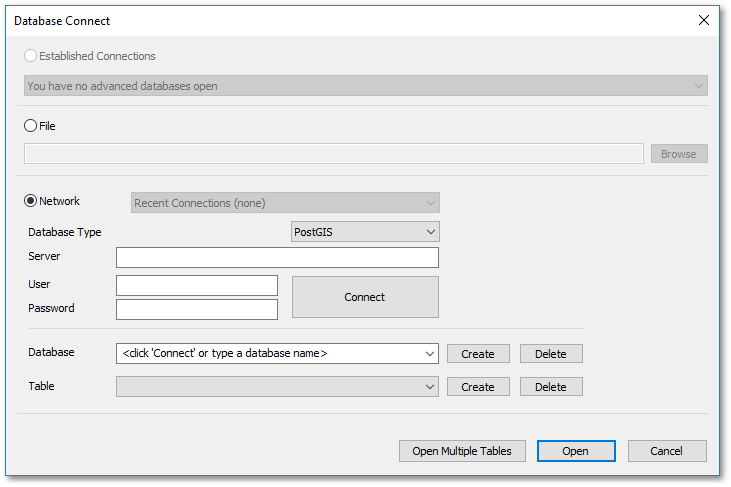
Add data from various sources.
Supports file data and geometric formats (by specifying the File option) and can also connect to a network (Network option) to access database tables (see below). The following Database Types are supported:
oPostGis
oMSSQL
oSDE
oOracle
Create Joined Table
To create a joined table, click ![]() Create Joined Table toolbar button (on the GIS Layer Manager Bar) or select from the main menu as indicated below:
Create Joined Table toolbar button (on the GIS Layer Manager Bar) or select from the main menu as indicated below:
GIS > Data > Create Joined Table (select from Main Menu)
![]() Create Joined Table (select icon on GIS Layer Manager)
Create Joined Table (select icon on GIS Layer Manager)
Create joined table.
This function opens the Create Joined Table box, to guide you through the process of creating a joined (output) table from two (input) tables, viz. a Left and a Right table, using common key field values for establishing the join between the two tables:
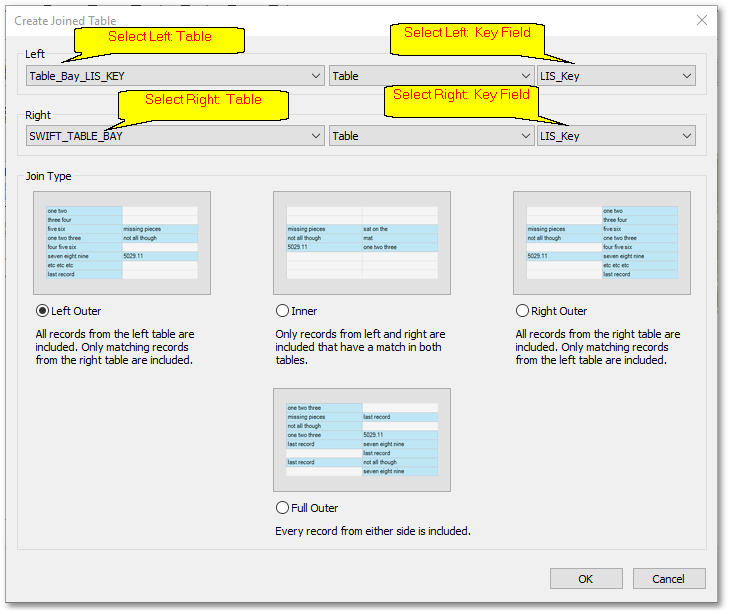
The above Join Type: Left Outer is used most often, therefore the default option. Notice the blue highlighted records followed by a short textual description of each Join Type.
Create Chained Joined Table
To create chained joined tables, click ![]() Create Chained Joined Table toolbar button (on the GIS Layer Manager Bar) or select from the main menu as indicated below:
Create Chained Joined Table toolbar button (on the GIS Layer Manager Bar) or select from the main menu as indicated below:
GIS > Data > Create Chained Joined Table (select from Main Menu)
![]() Create Chained Joined Table (select icon on GIS Layer Manager)
Create Chained Joined Table (select icon on GIS Layer Manager)
Create a chained joined table.
This function opens the Create Chained Joined Table box, to guide you through the process of creating a chained joined (output) table from one or more (input) table(s), using common key field values for establishing the connection between the tables. The input tables are in fact 'chained' onto one another via common key fields to form the joined output table. A short example is given below, to show the steps of constructing a chained joined table from various input tables.
•First we will view the contents of the tables by selecting them one after the other and for each one, click the ![]() Edit Database icon (on the GIS Layer Manager Bar). This step is actually not necessary for the chained join operation, but is recommended to get an overview of the data tables and fields:
Edit Database icon (on the GIS Layer Manager Bar). This step is actually not necessary for the chained join operation, but is recommended to get an overview of the data tables and fields:
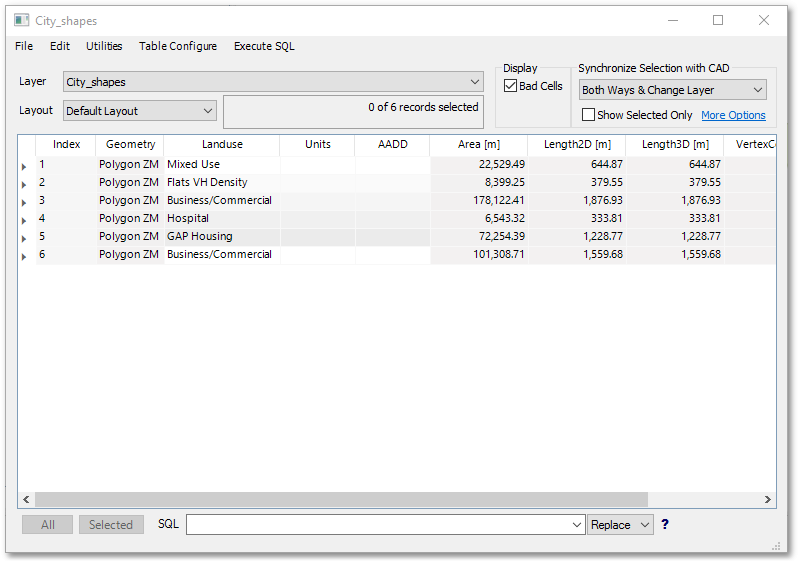
oPrimary table: City_Shapes:
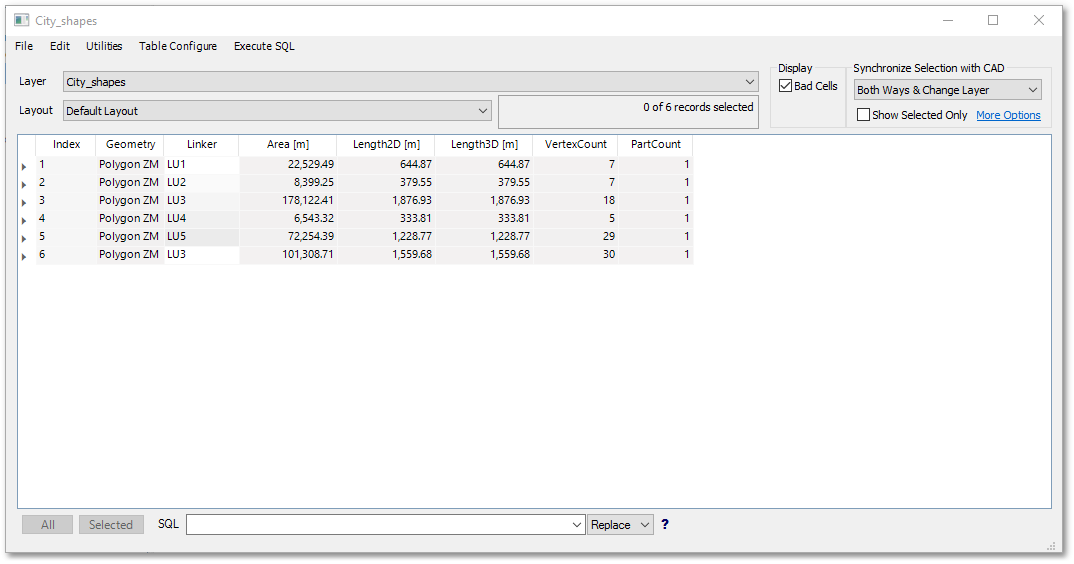
Notice the Linker field, which will be used as key field in the subsequent join operation.
oSecondary table: LandUse_Present:
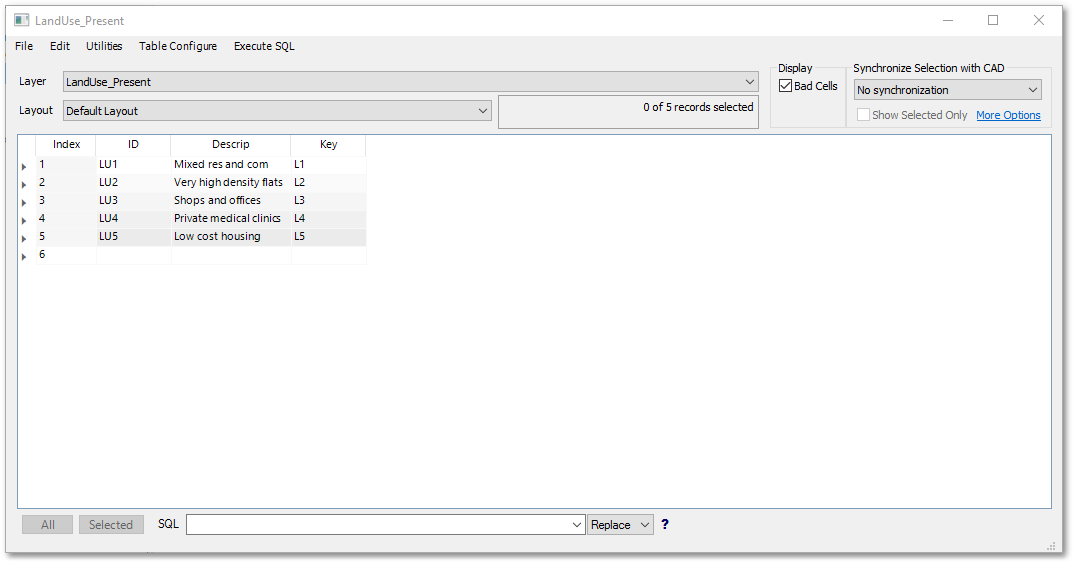
Notice the fields ID and Key, which will be used in the subsequent join operation. The field Descrip contains information on the present land use to be contained in the final joined table.
oSecondary table: LandUse_Future:
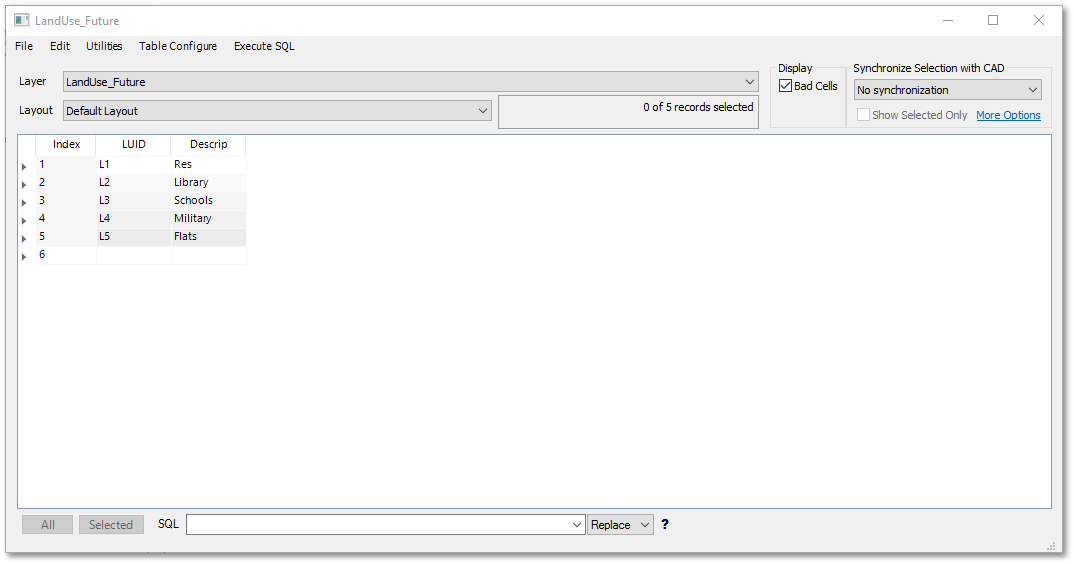
Notice the fields LUID, which will be used in the subsequent join operation. The field Fut_Descrip contains information on the future land use to be contained in the final joined table.
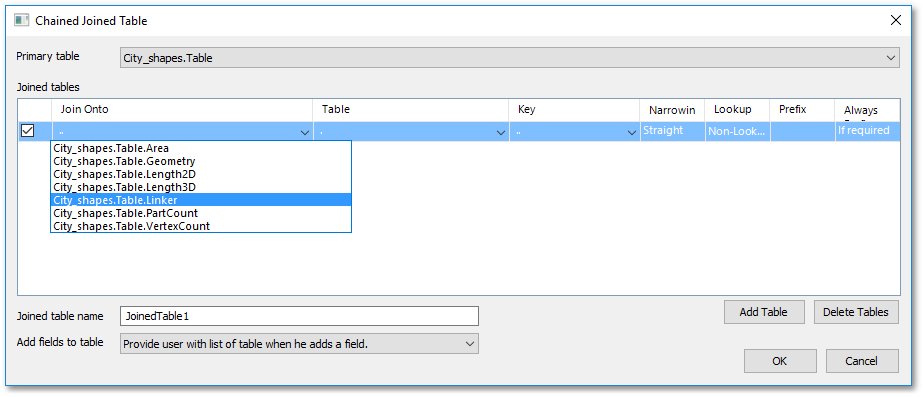
•Click on the Create Chained Joined Table icon as described above, to open the Create Chained Joined Table box.
•Select the Primary table from the top drop-down list (viz. City_shapes.Table).
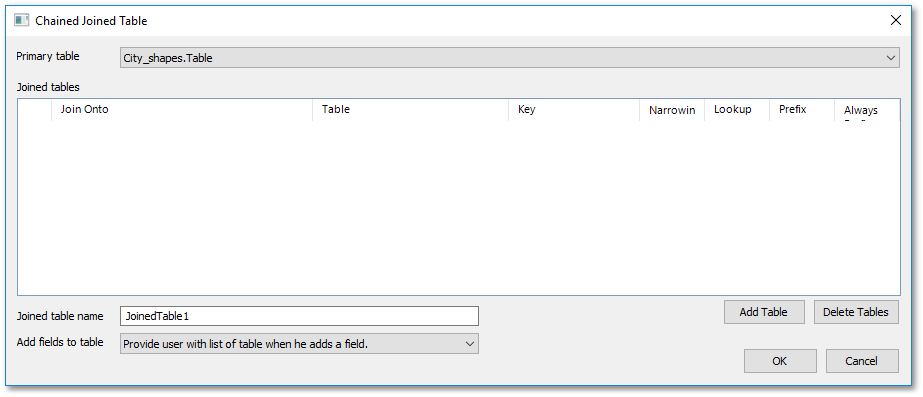
•Click the Add Table button. Select from the Join Onto drop-down list box the field: City_shapes.Table.Linker
•Select from the Table drop-down list the table: LandUse_Present.Table and the field LandUse_Present.Table.ID from the Key drop-down list. Specify Pres for Prefix. Click on the Always Prefix field to change its contents to Always.
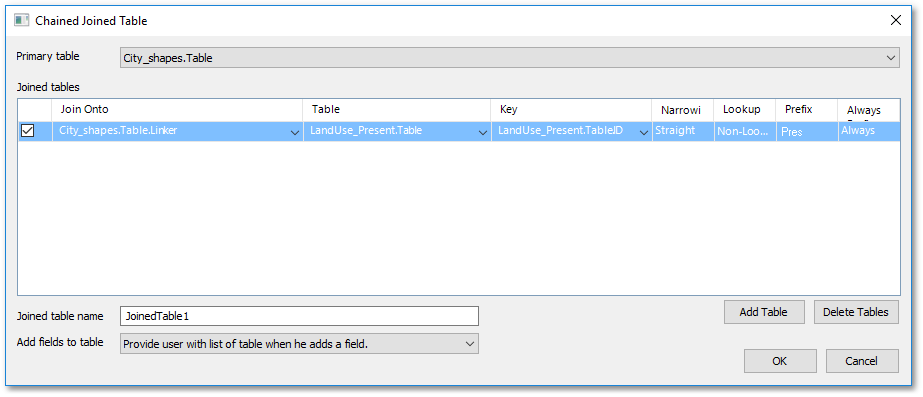
oThe above input can be interpreted as following: Landuse_Present.Table will be chained joined onto City_shapes.Table, via the common key fields City_shapes.Table.Linker and Landuse_Present.Table.ID
oA prefix viz., 'Pres' must be added to the present land use fields in the joined output table in order to distinguish them later from other future land use fields (which will be joined subsequently). The Always Prefix option is recommend to ensure it will always be added.
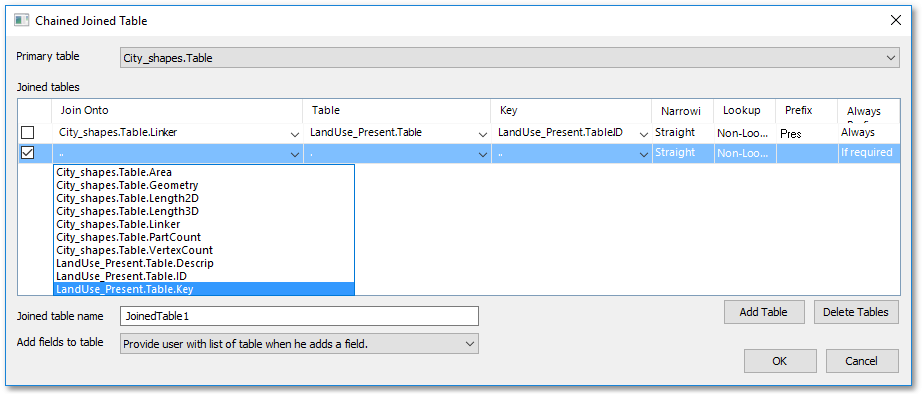
•Click again the Add Table button. Select from the Join Onto drop-down list box the field: Landuse_Present.Table.Key
Notice how the Join Onto drop-down list is now much longer than before, because it contains now all the additional fields from the Landuse_Present.Table which has been chained joined (onto City_shapes.Table).
•Select from the Table drop-down list the table: LandUse_Future.Table and the field LandUse_Future.Table.LUID from the Key drop-down list. Specify Fut for Prefix. Click on the Always Prefix field to change its contents to Always.
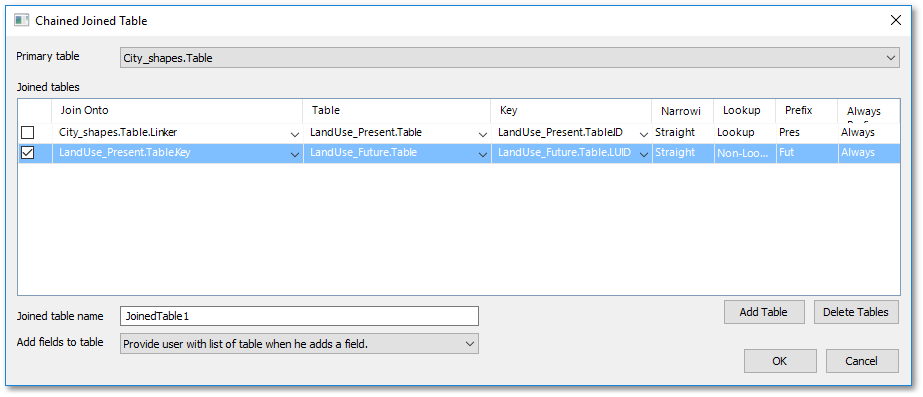
oThe above input can be interpreted as following: Landuse_Future.Table will be chained joined onto City_shapes.Table, via the common key fields City_shapes.Table.Key and Landuse_Future.Table.LUID
oA prefix viz., 'Fut' must be added to the future land use fields in the joined output table in order to distinguish them later from other present land use fields (which were joined earlier). The Always Prefix option is recommend to ensure it will always be added.
•Optionally, rename the final Joined table name (from JoinedTable1) to a better descriptive name such as JoinedTableFinal.
•Click OK button to create the final chained join table: JoinedTableFinal
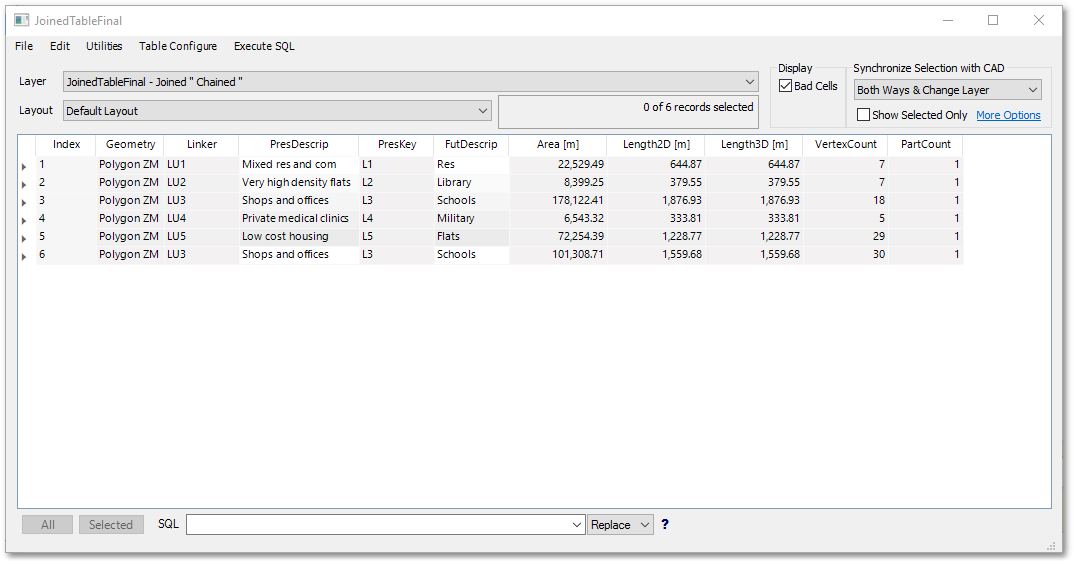
Note the above final output of the chained join (JoinedTableFinal) is in fact a new shapefile with its layer data table (also referred to as attribute table) shown above. This is because we started with a shapefile attribute table as primary table. You can perform chained joins also on non-spatial database tables only, the process is exact the same.
Refresh All Layers in CAD Drawing
To refresh all layers in the CAD drawing, click ![]() toolbar button (on the GIS Layer Manager Bar). Note, press Ctrl while clicking on the toolbar button to force a full refresh.
toolbar button (on the GIS Layer Manager Bar). Note, press Ctrl while clicking on the toolbar button to force a full refresh.
Refresh Labels
To refresh labels, click ![]() icon (on the GIS Layer Manager Bar) and select from the ensuing drop-down menu:
icon (on the GIS Layer Manager Bar) and select from the ensuing drop-down menu:
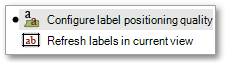
•Configure label positioning quality: Various options can be set from the ensuing Label Quality dialog box.
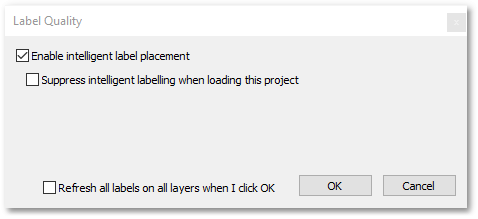
Enable intelligent label placement tick box can be ticked to place label according to the configured intelligent label placement strategy (see Render Settings: Layout Labels).
•Refresh labels in current view: Refresh labels in currently active view. To refresh all labels on all layers, use the above sub-menu option (last tick box on Label Quality box).
Adding an Empty Data Layer
To add an empty data layer, click the ![]() Create New Layer toolbar button (on the GIS Layer Manager Bar) and choose the Create Empty Layer menu item from the ensuing the drop-down menu or select from the main menu as indicated below:
Create New Layer toolbar button (on the GIS Layer Manager Bar) and choose the Create Empty Layer menu item from the ensuing the drop-down menu or select from the main menu as indicated below:
GIS > Data > Create Empty Layer (select from Main Menu)
![]() Create Empty Layer (select from drop-down menu on GIS Layer Manager Bar)
Create Empty Layer (select from drop-down menu on GIS Layer Manager Bar)
Create empty GIS layer.
Before creating the layer, you must choose the type of geometry that will be present in the layer from the Layer Type box:
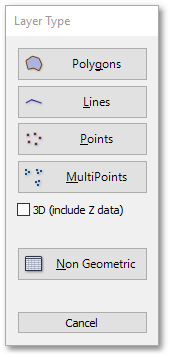
The above Non Geometric option can be chosen to create a layer that holds only non-spatial types of data (such as numbers and text).
Adding/Merging a Layer from CAD
To add/merge a layer from CAD, click the ![]() Create New Layer toolbar button (on the GIS Layer Manager Bar) and choose the Create/Merge Layer from CAD menu item from the ensuing drop-down menu or select from the main menu as indicated below:
Create New Layer toolbar button (on the GIS Layer Manager Bar) and choose the Create/Merge Layer from CAD menu item from the ensuing drop-down menu or select from the main menu as indicated below:
GIS > Data > Create/Merge Layer from CAD (select from Main Menu)
![]() Create/Merge Layer from CAD (select from drop-down menu on GIS Layer Manager Bar)
Create/Merge Layer from CAD (select from drop-down menu on GIS Layer Manager Bar)
Create/Merge layer from CAD.
Choose which CAD layers you will be importing, and specify whether to import those objects into a new GIS layer, or into an existing GIS layer (i.e. either type in a new layer name in the Destination GIS layer drop-down box, or select from it the existing GIS layer).
There are several parameters that control what types of CAD objects will be imported. For example, you may wish to bring circles in as point objects. In such a case, the circle center will be used to determine the point location. When importing for example polylines from CAD, you can specify to import them as polygon or polyline features, and whether only closed polylines/polygons should be imported.
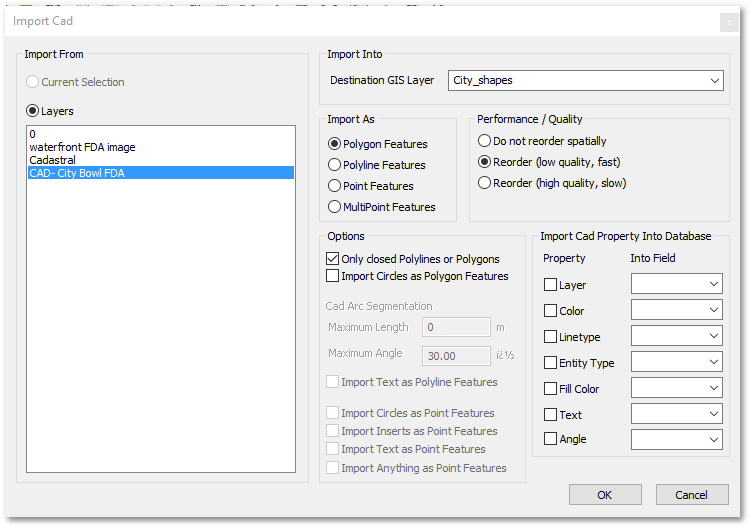
During CAD import, you may also bring over a few of the CAD objects' properties into GIS fields of your choice. This can be useful, for example, if you are importing a number of CAD layers at once, and you wish to preserve their CAD layer names in a database field. Other types of properties that you may import are symbol types, object colours, etc.
Render Settings
To open the Render Settings box, click ![]() Render Settings icon on the GIS Layer Manager Bar, or select from the main menu as indicated below:
Render Settings icon on the GIS Layer Manager Bar, or select from the main menu as indicated below:
GIS > Appearance > Render Settings (select from Main Menu)
![]() Render Settings (click icon on GIS Layer Manager Bar or select from Right-click Menu)
Render Settings (click icon on GIS Layer Manager Bar or select from Right-click Menu)
Open Render Settings box.
This function opens the Render Settings box in which render settings for the currently selected GIS layer can be set. The Render Settings box has the following tabs (for changing the input layouts):
Layout: Style
- Field
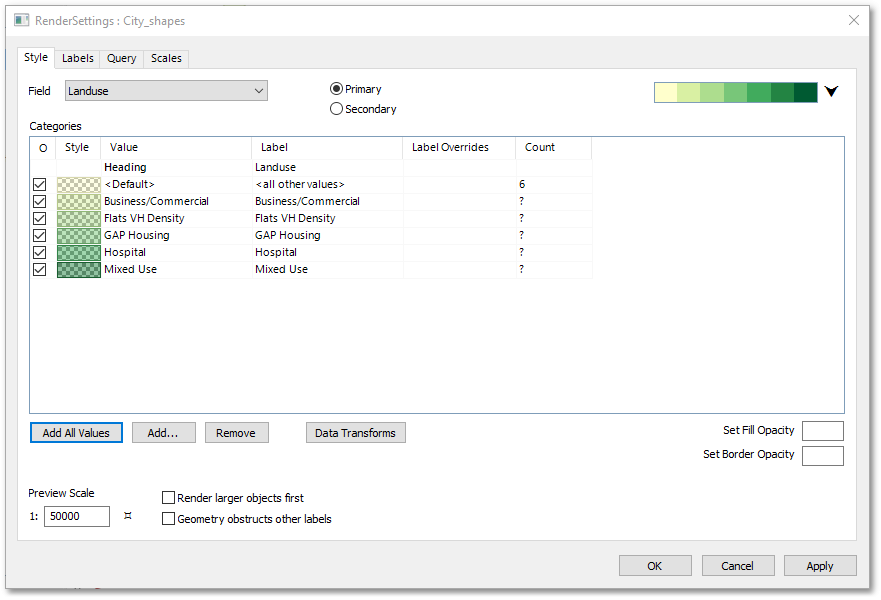
The currently active field on which on which the rendering will be based, on can be selected from the Field drop-down list. See example screen-shot above, where the Landuse field has been selected from the Field drop-down list.
- Palette
The Palette drop-down arrow can be clicked to open the Palette control.
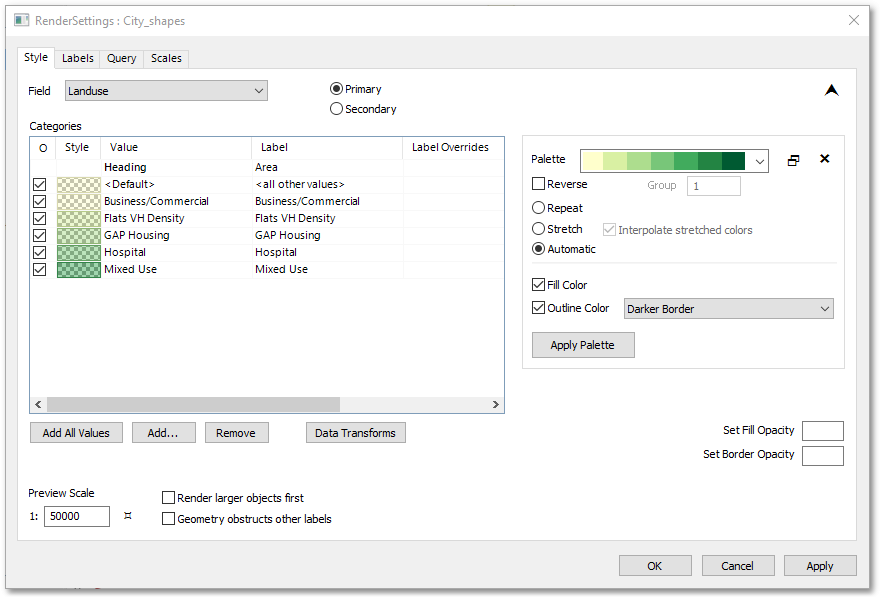
The Palette control has many settings, such as:
• Fill Color tick box (when unticked Palette fill colours will not be applied)
•Outline Color tick box (to apply outlines colours or not)
•Drop-down list to select the border darkness
•Palette colours can set by clicking the ![]() icon, which will open the Color Palette box:
icon, which will open the Color Palette box:
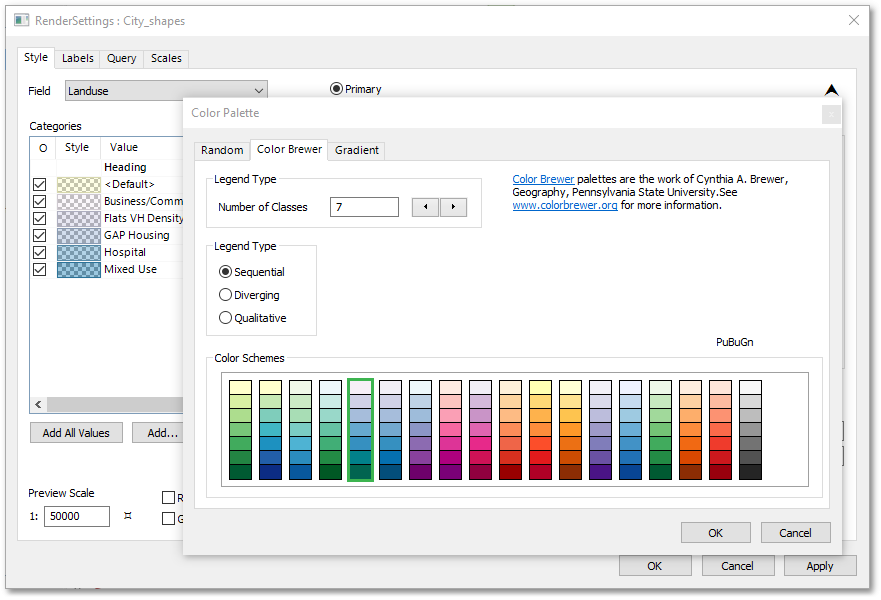
The above Color Brewer classification schema (developed by Cynthia A. Brewer) is the default option. The Number of Classes can be specified to change the number of vertical colour blocks. The Legend Type has the following colour ramping options: Sequential , Diverging and Qualitative. The first (default) option is Sequential, which provides a gradual transition from light to darker colours.
Random and Gradient are other colour classification schemas that can be accessed from the Color Palette box, which will result in different colour ramping effects.
Note, if colour ramping is not applicable to your data such as for landuse categorization, then you can simply click on the colour palettes in the render settings box to open the Pick Style box and change the colour of the individual categories (as described in the Quick Start Guide).
- Add All Values
The Add All Values button can be clicked to automatically generate categories for all unique values of the currently selected field. See example screen-shot above, where categories have been generated for the Landuse field.
- Add...
The Add... button opens the following sub-meu where most of the style category functions can be accessed:
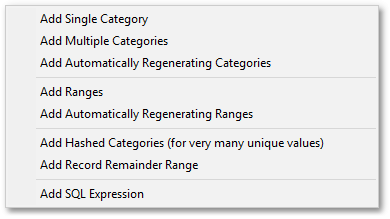
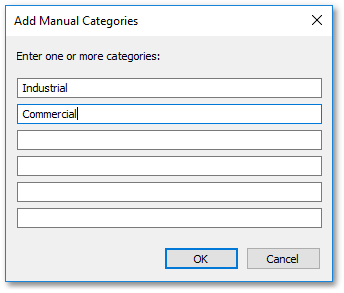
•Add Single Category: One or more categories can be added manually via the Add Manual Categories box:
•Add Multiple Categories: Multiple Categories can be added by selecting them from the Pick Categories to Add box:
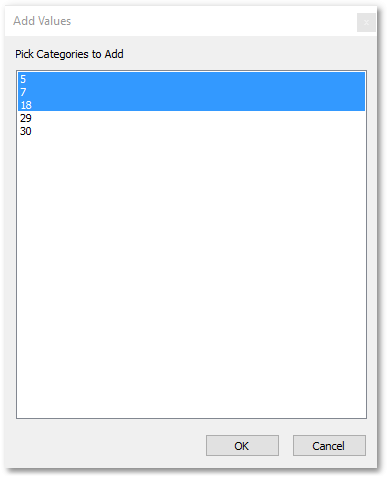
Note, all unique values of the currently selected field are automatically displayed in the above box (and are selectable).
•Add Automatically Regenerating Categories: This menu item has the same function as the Add All Values button, viz. automatically generate categories for all unique values of the currently selected field.
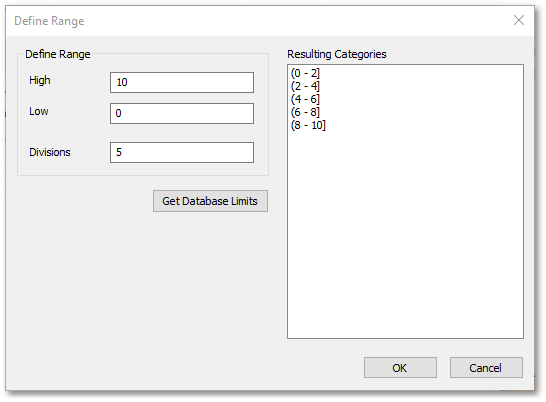
•Add Ranges: The Add Ranges menu item opens the Define Range box. From the Define Range box, you can set up the Resulting Categories to focus only on a specific range by specifying High and Low values. Alternatively, click the Get Database Limits button to define the full data range. The number of divisions values must be entered to specify the number of categories to generate. The example below shows a range between 0 and 10 with 5 categories in increments of 2:
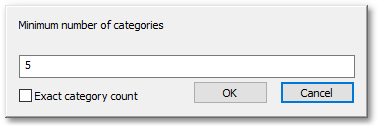
•Add Automatically Regenerating Ranges: This menu item opens the Minimum number of categories box, in which the minimum number of categories for the automatic category generation can be specified. If Exact category count is not ticked, then more categories may be generated to obtain better category breaks.
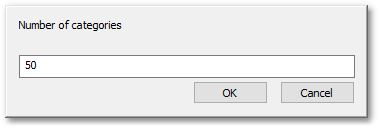
•Add Hashed Categories (for very many unique values): You will be prompted for the number of uniquely coloured hashed categories to add to the Render Settings box (to be used in subsequent categorization).
Add Record Remainder Range: You will receive the same prompt as above, but in this case Record Remainder catergories will be added. These are useful to indicate entities that were not rendered previously. The Render Settings box will be updated the following: Value field will receive incremental values starting with one, and the the Label field will be labeled with 'Record Remainder X (where X will also be incremented by each record remainder added).
•Add SQL Expression: Opens the Script box in which an SQL Script can be entered to defined a custom search criteria for values to be contained in a category.
The Render Settings box will automatically be updated with the following: The SQL query expression will be added to the Value field and the phrase 'Expression' will be inserted in the Label field. The latter, can afterwards be edited with a custom description.
- Remove
The Remove button removes a selected category. A category to be removed, can be selected by clicking on or dragging over the 'Value' column. Note, you cannot delete the <Default> or the header categories.
- Data Transforms
Options on Case Sensitivity, Absolute Value and Numeric Tolerance can be specified here. These options will affect the cutoff margins for Single categories and Range categories, they do not affect SQL-based categories.
- Set Fill Opacity
Set opacity of all selected fill colours. A value for opacity can be entered in the white input box ranging from 0 (completely transparent) to 100 (completely opaque).
- Set Border Opacity
Set opacity of all selected borders. A value for border opacity can be entered in the white input box ranging from 0 (completely transparent) to 100 (completely opaque).
Layout: Labels
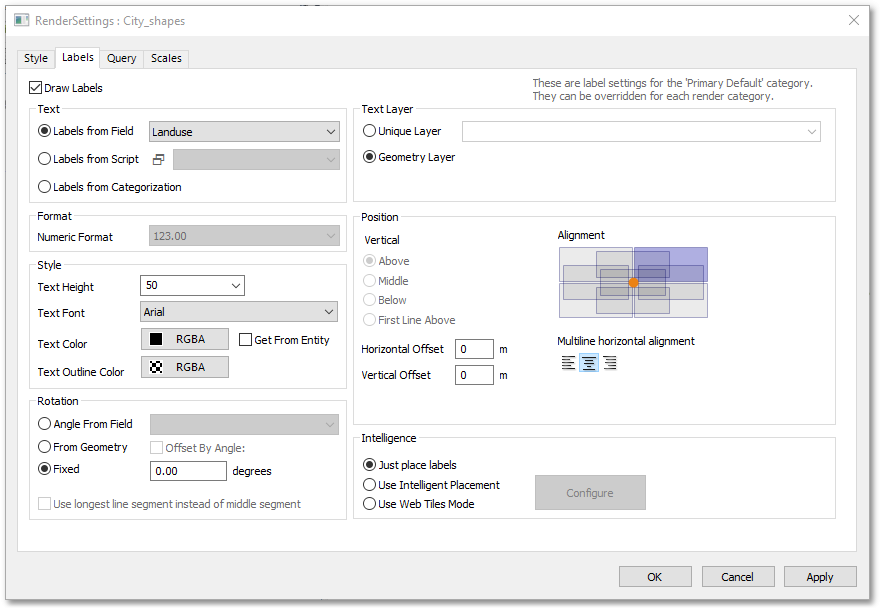
- Draw Labes
The Draw Labels tick box can be ticked to display the labels in the spatial environment (as configured in the Render Settings box). When unticked, the labels will not be displayed.
- Text
•Labels from Field: Labels can be placed based on textual information contained in field values. The field can be selected from a drop-down list (see above, where the field Landuse is e.g. selected).
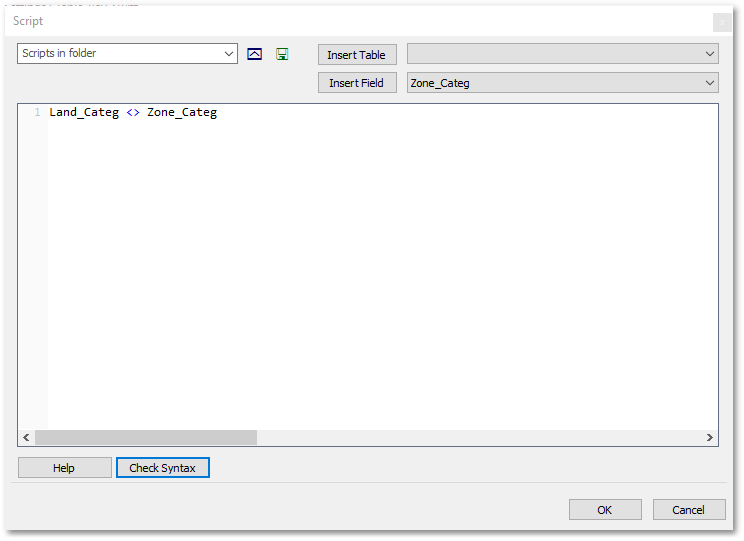
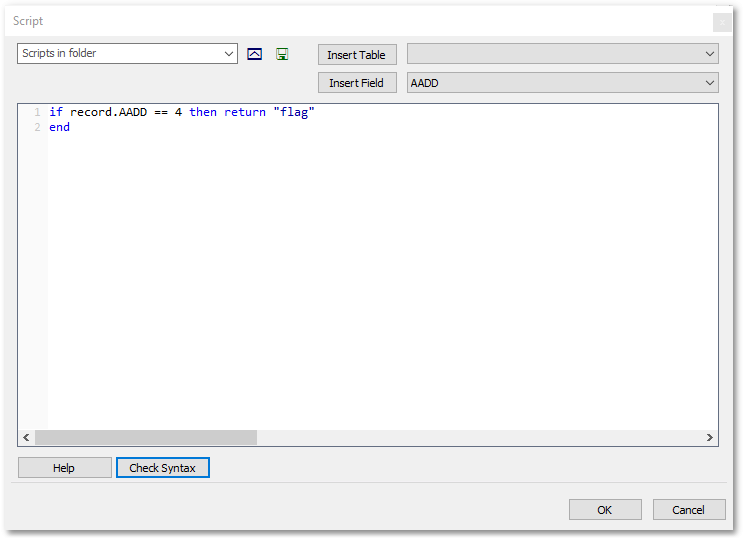
•Labels from Script: Labels can be placed via a Lua Script. The Script box can be opened by clicking on the ![]() Script icon (see above screen-shot) in which the Lua Script can be entered. Scripts can also be selected from the drop-down list next to the
Script icon (see above screen-shot) in which the Lua Script can be entered. Scripts can also be selected from the drop-down list next to the ![]() Script icon. For example the script shown below, labels parcels with the phrase "flag" when their AADD = 4 kl/day. The Check Syntax button can be clicked to check the syntax of the specified query, and obtain correction suggestions if the syntax was faulty.
Script icon. For example the script shown below, labels parcels with the phrase "flag" when their AADD = 4 kl/day. The Check Syntax button can be clicked to check the syntax of the specified query, and obtain correction suggestions if the syntax was faulty.
•Labels from Categorization: Labels can be placed according to the Label text specified for the Categories (as discussed above for the Render Settings: Style box).
- Format
Numeric Format: The numeric format of the labels can be selected from the Numeric Format drop-down list. This list is only enabled when you specify a numeric field from the above described Labels from Field drop-down list.
- Style
•Text Height: The text height of the labels can be set from Text Height drop-down list. You must first select from the list the units (default is true world units, such as meters) and then enter in the field the height. The other units that can be specified from the list are: points (1/72 inch on paper), vmm (screen millimetres) and px (screen pixels).
•Text Font: The text font of the labels can be selected from Text Font drop-down list. The standard fonts that can be selected from the list are: Arial and Segoe UI. Other fonts can, however, be specified by selecting the Add new style/font... from the list which will open the Font box where various Fonts, Font style, Size and Script can be selected. The latter changes the character sets to comply with other language regions such as Western, Hebrew Arabic, Greek, etc.
•Text Color: The text color of the labels can be selected from the Color box, which opens when clicking on the RGBA button. The Get From Entity tick box can be ticked, to inherent the colour from the colour of the underlying rendered entity (which the label is associated with).
•Text Outline Color: The text outline color of the labels can be selected from the Color box, which opens when clicking on the RGBA button, located just below the RGBA button for Text Color (described above).
- Rotation
•Angle from Field: The labels can be rotated based on the field values contained in a specified 'rotation' field. This field can be selected from the adjacent drop-down list.
•From Geometry: The labels can be rotated based on the underlying geometry (which the label is associated with). If the underlying geometry is a polyline, then a tick box will be enabled which can be ticked to specify that the label placement and rotation should be based on the longest line segment instead of the the middle segment.
•Fixed: The labels are rotated based on a specified fixed degrees value.
- Text Layer
•Unique Layer: The labels can be placed on a separate new layer by entering the name of the new layer in the adjacent drop-down list box or simply accept the default name.
•Geometry Layer: The labels can be placed on the same layer as the underlying geometric entity (which the label is associated with).
- Position
•Alignment: The label alignment can be specified by clicking on the interactive graphic (a purple box will highlight to indicate the label placement relative to the orange centre point).
•Horizontal Offset and Vertical Offset: Can be specified in metres.
•Multi-line horizontal alignment: When labels stretch over more than one line, their horizontal alignment can be set via clicking on interactive graphic (lines of text will highlight accordingly).
- Intelligence
•Just place labels: Labels will simply be placed without any intelligent placement strategy.
•Use Intelligent Placement: Click the Configure button to open the Intelligent Label Placement box. TheIntelligent Label Placement box has the following tabs (for changing the input layouts):
Layout: Placement Options
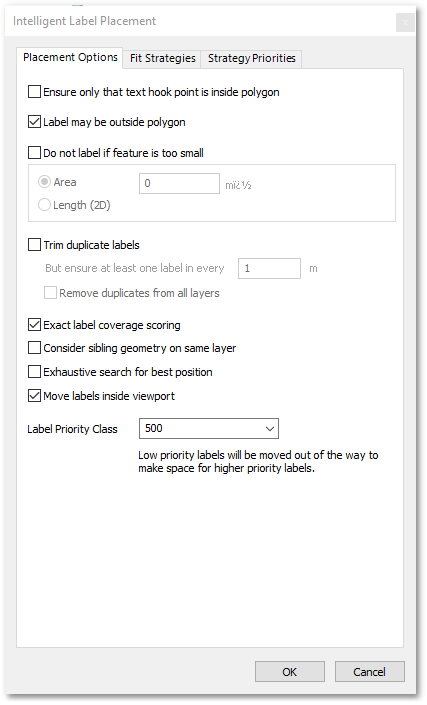
oEnsure only that text hook point is inside polygon: This ensures that the labels are inside polygons. If unticked, then the option below will become enabled.
oLabel may be outside polygon: Can be ticked to allow labels to appear outside polygons.
oDo not label if feature is too small: A minimum Area or Length can be specified.
oTrim duplicate labels: Optimum spacing between labels can be set, and it can be specified to remove duplicates from all layers.
oMove labels inside viewport: This allows labels to extend into viewport areas.
oLabel Priority Class: A Label Priority Class value can be assigned to the labels of the current layer, between 1000 (Highest) and 0 (Lowest). The median class is 500 (Default). Low priority labels will be moved out of the way to make space for high priority labels.
Layout: Fit Strategy
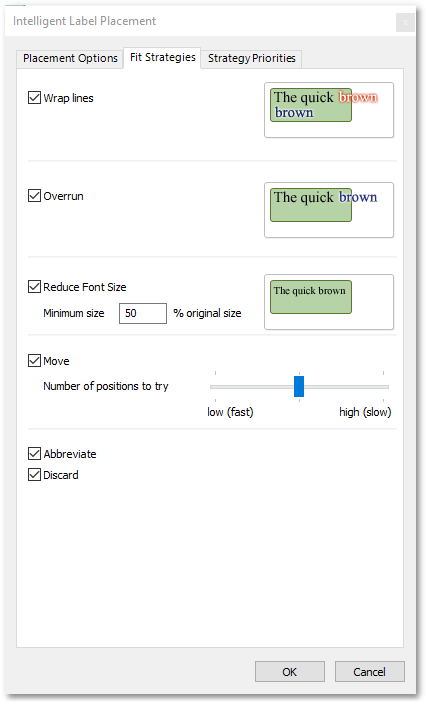
oWrap lines: When ticked, allows for the text of labels to wrap over to the next line(s) in order to fit in.
oOverrun: Allows text to overshoot when they not fit in.
oReduce Font Size: When Reduce Font Size is allowed, you can specify the minimum size in percentage of the original size a font may be reduced.
oMove: When text moving is allowed, you can specify (for the label placement algorithm) the number of positions to try by shifting the grahical ruler between low (fast) and high (slow). Basically a tradeoff between processing speed and label quality.
oAbbreviate: Allows for labels to be abbreviated in order to fit in.
oDiscard: Specifies if a label may be removed when there is no ideal fitting.
Layout: Strategy Priority
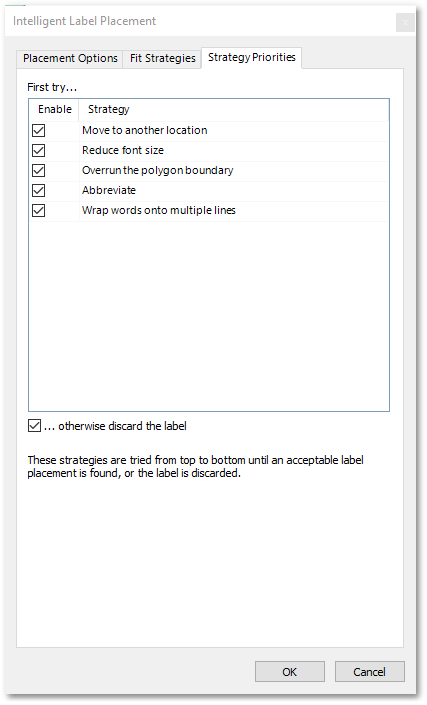
The above Strategy Priority box is a (priority) list box where you can click and and drag strategy items up or down in the hierarchy. Strategies are tried from top to bottom until an acceptable label placement is found, or the label is discard (if label Discard is enabled). Note, you can either enable/disable the strategies by clicking the tick boxes on this input layout page, or on the Fit Strategies layout page as already discussed . The two input pages are interconnected, i.e. edits made on the one page will automatically be reflected on the other.
Layout: Query
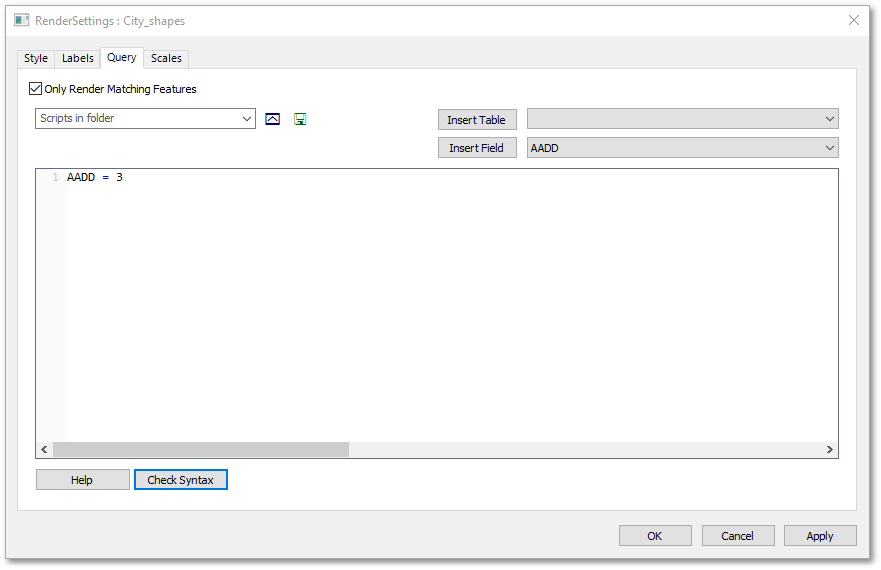
- Only Render Matching Features
The Only Render Matching Features tick box can be ticked to only render features in the spatial environment (as configured in the Render Settings box) that match an SQL query as defined in the above SQL query box. The non-matching features will then not be rendered and will not be displayed. When unticked, however, all features will be displayed regardless of the query outcome. For example the script shown above, will render only parcels with AADD = 3 kl/day. The Check Syntax button can be clicked to check the syntax of the specified SQL query, and obtain correction suggestions if the syntax is incorrect.
Layout: Scale
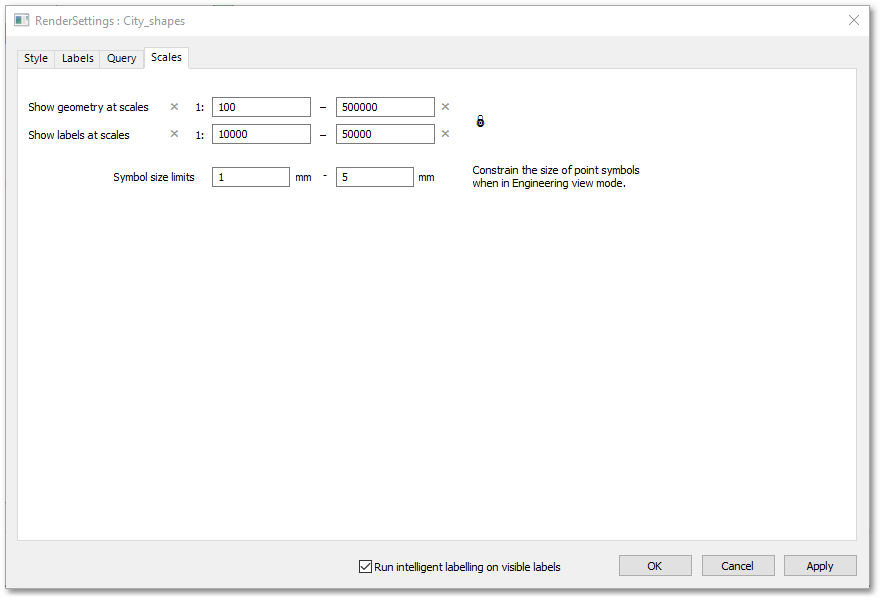
The allowable scales for drawing geometric entities and labels and the symbol size (mm) range for drawing point symbol can be specified as shown in the example above. This will prevent the drawing get cluttered when zooming in too much and to prevent details showing when zooming out too far. Note, to get the Show labels at scales input boxes enabled (for inputting scales) click on the ![]() Scale Lock icon.
Scale Lock icon.
Zoom to extents of selected GIS layer
To zoom to the extents of the currently selected GIS layer, click the Zoom to Layer Extents toolbar button (icon) on the GIS Layer Manager Bar, or select from the main menu as indicated below:
GIS > Appearance > Zoom to Layer Extents (select from Main Menu)
![]() Zoom to Layer Extents (click icon on GIS Layer Manager Bar or select from Right-click Menu)
Zoom to Layer Extents (click icon on GIS Layer Manager Bar or select from Right-click Menu)
Zoom to layer extents.
This function zooms to the entire extents of the currently selected GIS layer.
Edit or view the associated database table of a selected GIS layer
To open the associated database table of the currently selected GIS layer, click the Edit Database toolbar button (icon) on the GIS Layer Manager Bar, or select from the main menu as indicated below:
GIS > Edit Database (select from Main Menu)
![]() Edit Database (click icon on GIS Layer Manager Bar or select from Right-click Menu)
Edit Database (click icon on GIS Layer Manager Bar or select from Right-click Menu)
Open database table.
This function opens the database table (also referred to as grid) of the currently selected GIS layer for viewing or editing.
See Also
Remove GIS layer from project
To remove the currently selected GIS layer, click the Remove Layer toolbar button (icon) on the GIS Layer Manager Bar, or select from the main menu as indicated below:
GIS > Data > Remove Layer (select from Main Menu)
![]() Remove (click icon on GIS Layer Manager Bar or select from Right-click Menu)
Remove (click icon on GIS Layer Manager Bar or select from Right-click Menu)
Remove GIS layer from project.
This function removes a selected GIS layer from the project.
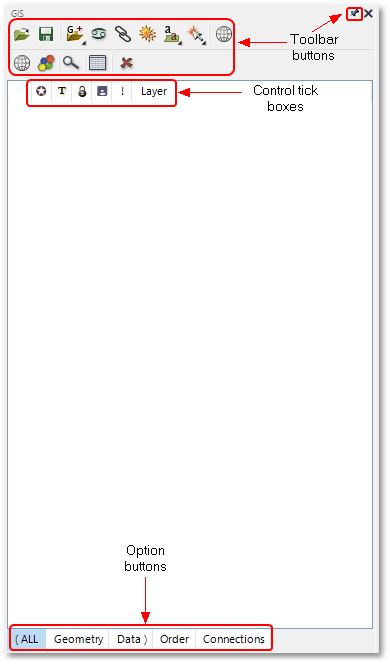
Control tick boxes
The following tick boxes can be set to control the display of the GIS data (see GIS Layer Manager screen-shot at top of page):
![]() Layer Visibility: The layer visibility can be switched on and off.
Layer Visibility: The layer visibility can be switched on and off.
![]() Label Visibility: Label display on layer can be switched on and off. See Render Settings to setup labels.
Label Visibility: Label display on layer can be switched on and off. See Render Settings to setup labels.
![]() Locked status: Layer can be locked to prevent edits.
Locked status: Layer can be locked to prevent edits.
![]() Modified status: The blue star will appear when layer has been edited. Click on blue star to open Save or Discard dialog box.
Modified status: The blue star will appear when layer has been edited. Click on blue star to open Save or Discard dialog box.
![]() New status: The red star will appear when it is a new layer that has not been saved yet. Click on red star to open the Save As dialog box.
New status: The red star will appear when it is a new layer that has not been saved yet. Click on red star to open the Save As dialog box.
![]() Projection setup: Provides a hyperlink to the Projections box to view or edit the projection of the currently selected layer.
Projection setup: Provides a hyperlink to the Projections box to view or edit the projection of the currently selected layer.
Option buttons
The following option buttons at the bottom of the GIS Layer Manager (see screen-shot at top of page) can be clicked to re-arrange the layer list:
•ALL: Displays all layers (both geometric shapes and data tables).
•Geometry: Displays only geometric layers.
•Data: Displays only data tables.
•Order: Displays all geometric layers and allows for drawing order re-arrangement. The drawing order can be changed by shifting a layer up or down in the list (via left-click and drag).
•Connections: Displays full data source (path) to all layers.